Date: Thu, 9 Mar 2017 11:15:34 +1300
Hi Lungi,
Thanks for your reply.
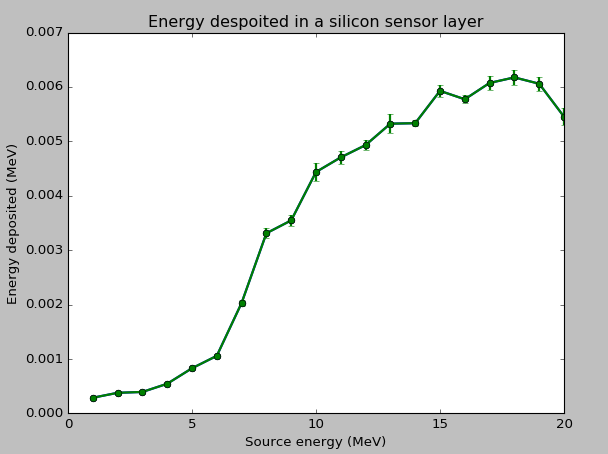
I ran 5 cycles for each input file with 100000 primaries and calculated the
error using the formula which you pointed out. I see that the plot is much
better and more smoother now.
[image: Inline images 1]
I have shown the error (std(variance)) on the plot. Do you think this is
the correct way of representing them?
What are the ways of further reducing errors and achieving 3 sigma in this
case? It is based on the Z score calculated using the formula [Z=
(avg-mean)/std].
Thanks in advance.
Cheers,
Shri
(Srinidhi Bheesette)
On 6 March 2017 at 22:10, Luigi Salvatore Esposito <
luigi.salvatore.esposito_at_cern.ch> wrote:
> Dear Srhi,
> if you run parallel runs, then each FLUKA input file needs to have its own
> initialisation of the random generator,
> i.e. different WHAT(2) of the RANDOMIZe card (see Note 5 in the manual of
> the RANDOMIZe card). The user should take care of it.
>
> On the other hand, cycles within the same run have automatically
> independent histories since FLUKA will use the last random number seed
> from the previous cycle.
>
> You have to average over cycles. The post-processing utilities in FLUKA
> make this job for you.
> Again, as I already recommended in my previous email, please refer to the
> slides about statistics from the last FLUKA course:
>
> https://indico.cern.ch/event/540415/contributions/2194806/
> attachments/1285749/1912258/09_Statistics_and_sampling_2015.pdf
>
> in particular slide 32 and following. You can assume batch = cycle.
> Best regards, luigi
>
>
> On 6 Mar 2017, at 06:29, Srinidhi Bheesette <srinidhi.bheesette_at_cern.ch>
> wrote:
>
> Hi Andrew,
>
> 1. Let say I increase the number of primaries in the input file to
> 1000000. Then how do I split the jobs?
> Should create 5 different input files with different random number and run
> it once or run each run (again with different random seed in each) for 5
> cycles?
> eg: My input file has 100000 primaries specified. I created 5 different
> input files with 5 different random seeds and am running each 5 cycles for
> each input file, and am scoring USRBIN every time.
>
> So at the end of the whole process, I get 5 fort files (from 5 cycles) for
> each input file (hence run) and since there are 5 runs = 5* 5 = 25 fort
> files.
>
> Should should be the averaging be done in this scenario over runs or over
> cycles?
>
> Please help.
>
> Cheers,
> Shri
>
> (Srinidhi Bheesette)
>
> On 1 March 2017 at 15:26, Andrew Davis <andrew.davis_at_wisc.edu> wrote:
>
>> Hi Srinidhi
>>
>> There are a number of issues assuming that your input deck is
>> representative
>>
>> 1) Your START card only contains a single history to run, from a single
>> run of 1 primary you cannot make any assertions regarding the results of
>> your calculation since you have a large statistical uncertainty. You should
>> likely run several million histories with (at least) 5 independent random
>> number seeds using the already established tools to perform the averaging.
>> 2) You used a USRBIN score (with 1 bin for x-y-z) to determine the energy
>> deposition, you might as well use a USRTRACK score, not an issue really,
>> but I may’ve chosen a USRTRACK instead
>> 3) Your plot doesn’t include any statistical error, its hard judge the
>> accuracy of a Monte Carlo calculation without any mention of the
>> statistical error.
>>
>> Thanks
>>
>> Andy
>>
>> On Feb 28, 2017, at 4:57 PM, Srinidhi Bheesette <
>> srinidhi.bheesette_at_cern.ch> wrote:
>>
>> Hi all,
>>
>> I have simulated a pixel detector (just a silicon sensor layer) in FLUKA
>> and bombarding it with point neutron source at different energies from
>> 1-25.5MHz with a step size of 0.5MHz. I run a single simulation.
>>
>> I then score the energy deposited in the detector (one value for one run)
>> and then plot a graph of the energy deposited on the x-axis the source
>> energy on the y-axis shown below:
>>
>> <image.png>
>>
>> The energy seems to increase till 20MeV but then start fluctuating from
>> 20.5 to 25.5MeV and also a spike at 17MeV
>>
>> Am I missing some cards in my input file (attached) for activating some
>> feature for neutron energies after 20MeV?
>>
>> Please help.
>>
>> Cheers,
>> Shri
>>
>> (Srinidhi Bheesette)
>> <sensor-22.5MeV.inp>
>>
>>
>>
>
>
__________________________________________________________________________
You can manage unsubscription from this mailing list at https://www.fluka.org/fluka.php?id=acc_info
(image/png attachment: image.png)