Date: Sat, 18 Mar 2017 17:02:55 +1300
Hi Andy,
Thanks for your reply.
1.* FLUKA tools:* That write I am doing it manually using a python script.
I also checked the errors with a script written by my colleague and they
match. Meanwhile I will read about the FLUKA tools.
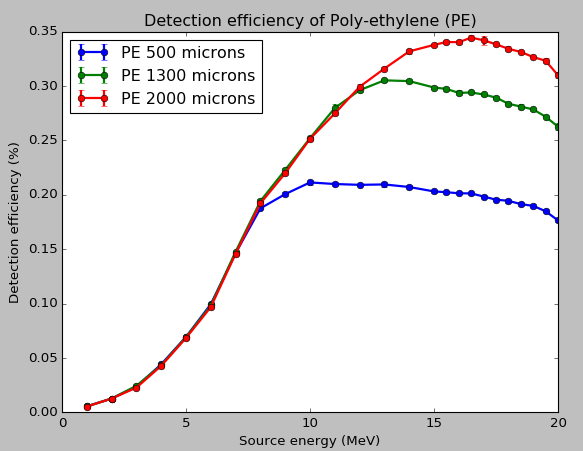
2. *Detection efficiency:* In the paper, I am referring to it is defined as
"Detection efficiency is defined as the ratio of the number of detected to
incoming neutrons" which went plotted (along with error bars) matches with
my reference plot.
[image: Inline images 1]
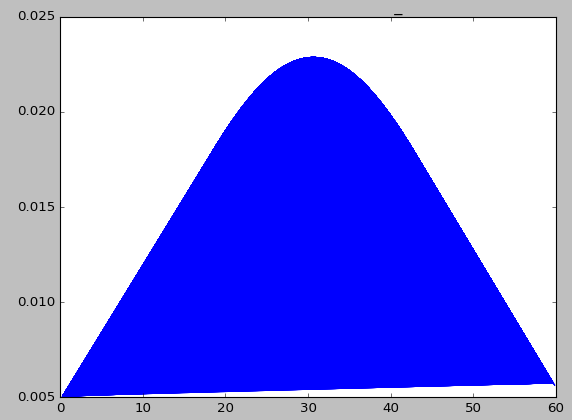
3.* Normal distribution of data:* To see if the data obtained from
eventdat card follows a normal dist. and I get the following graph with
energy on the y-axis and the normal pdf of the data from eventdat:
[image: Inline images 1]
4. *Artifacts: *In my geometry, the thickness of the conversion layer is
1.3mm (made of Poly-ethylene) and that of the sensor is 300micorns (made of
Silicon). Will this cause a problem?
Thanks.
Cheers,
Shri
(Srinidhi Bheesette)
On 16 March 2017 at 03:57, Andrew Davis <andrew.davis_at_wisc.edu> wrote:
> Hi Shri
>
> You are calculating the mean and variance by hand, rather than use the
> tools that come with Fluka? These tools are outlined in
> https://indico.cern.ch/event/296741/contributions/
> 1657814/attachments/556514/766704/08_Output_and_Plotting_2014.pdf
>
> My opinion, looking at your plots is that you need better statistics, a
> movement of the mean by a few standard deviations and you could get the
> plot you are comparing against. That being said you are plotting energy
> deposited as opposed to detection efficiency (I’m not aware of the
> relationship between the two).
>
>
> 1. How do I make the plot smoother?
>
> I would say if you are not CPU limited just run more particles & batches,
> I would presume your simulations are pretty quick (of the order of minutes?)
>
>
> 1. How do I justify that my results are valid? Are there are variable
> to be calculated to confirm the certainty of the measurements?
>
> Justification of valid results is a pretty broad questions. Do the results
> make physical sense? Are the errors sufficiently low to justify that the
> simulation has converged? Without knowing what you plan on using the
> simulations for its hard to advise really.
>
> Also, one should be careful of the use of results of neutrons when the
> geometry is thin, due to artifacts that can be introduced by the
> approximations in the angular treatment of the nuclear data for low energy
> neutron transport (see https://indico.cern.ch/event/296741/contributions/
> 1657819/attachments/556519/766716/10_Low_Energy_Neutrons_2014.pdf).
>
> Thanks
>
> Andy
>
>
> On Mar 10, 2017, at 6:01 PM, Srinidhi Bheesette <
> srinidhi.bheesette_at_cern.ch> wrote:
>
> Hi Andrew,
>
> Thanks for your reply. I have modified my geometry as shown below:
> <image.png>
> (sorry the conversion layer is not to scale)
>
> I am running 100000 primaries and 5 cycles. Averaging over 5 cycles and
> calculating the variance and the std deviation (sqrt(variance) using the
> formula below:
>
> <image.png>
>
> Where,
>
> · N = number of batches/cycles = 5
>
> · ni = number of primaries in each batch/cycle = 100000
>
> · n= number of primaries in the N batches = 100000*5 = 500000
> primaries
> And I have plot the averages and the std dev below:
> <image.png>
>
> I am sorry I donot have something to compare against expect this reference
> plot:
> <image.png>
> where the author of the paper has plotted the detection efficiency of
> poly-ethylene conversion layer of various thickness to fast neutron
> (1-20MeV).
>
> I did perform simulations by modifying the thickness of the conversion
> layer and got this graph.
> <image.png>
>
> I have got a few doubts:
>
> 1. How do I make the plot smoother?
> 2. How do I justify that my results are valid? Are there are variable
> to be calculated to confirm the certainty of the measurements?
>
> Your help would be greatly appreciated.
>
> Thanks in advance.
>
>
> Cheers,
> Shri
>
> (Srinidhi Bheesette)
>
> On 9 March 2017 at 15:46, Andrew Davis <andrew.davis_at_wisc.edu> wrote:
>
>> Hi Shri
>>
>> It looks much better, that looks like the correct way to plot them to me.
>>
>> Your setup is quite thin if I recall, so running more histories would
>> seem quite sensible. One typically expects that the statistical error goes
>> as 1/sqrt(N) where N is the number of particles simulated, so a factor of
>> 10 more particles will reduce your error by a factor of around 3.
>>
>> In terms of your 3 sigma reference, you usually worry about 3 sigma when
>> comparing to other data, for example under certain circumstances you might
>> expect 99% of data points to lie within 3sigma of your calculated data, in
>> your case do you have something to compare against?
>>
>> Thanks
>>
>> Andy
>>
>>
>> On Mar 8, 2017, at 4:15 PM, Srinidhi Bheesette <
>> srinidhi.bheesette_at_cern.ch> wrote:
>>
>> Hi Lungi,
>>
>> Thanks for your reply.
>>
>> I ran 5 cycles for each input file with 100000 primaries and calculated
>> the error using the formula which you pointed out. I see that the plot is
>> much better and more smoother now.
>>
>> <image.png>
>>
>> I have shown the error (std(variance)) on the plot. Do you think this is
>> the correct way of representing them?
>>
>> What are the ways of further reducing errors and achieving 3 sigma in
>> this case? It is based on the Z score calculated using the formula [Z=
>> (avg-mean)/std].
>>
>> Thanks in advance.
>>
>> Cheers,
>> Shri
>>
>> (Srinidhi Bheesette)
>>
>> On 6 March 2017 at 22:10, Luigi Salvatore Esposito <
>> luigi.salvatore.esposito_at_cern.ch> wrote:
>>
>>> Dear Srhi,
>>> if you run parallel runs, then each FLUKA input file needs to have its
>>> own initialisation of the random generator,
>>> i.e. different WHAT(2) of the RANDOMIZe card (see Note 5 in the manual
>>> of the RANDOMIZe card). The user should take care of it.
>>>
>>> On the other hand, cycles within the same run have automatically
>>> independent histories since FLUKA will use the last random number seed
>>> from the previous cycle.
>>>
>>> You have to average over cycles. The post-processing utilities in FLUKA
>>> make this job for you.
>>> Again, as I already recommended in my previous email, please refer to
>>> the slides about statistics from the last FLUKA course:
>>>
>>> https://indico.cern.ch/event/540415/contributions/2194806/at
>>> tachments/1285749/1912258/09_Statistics_and_sampling_2015.pdf
>>>
>>> in particular slide 32 and following. You can assume batch = cycle.
>>> Best regards, luigi
>>>
>>>
>>> On 6 Mar 2017, at 06:29, Srinidhi Bheesette <srinidhi.bheesette_at_cern.ch>
>>> wrote:
>>>
>>> Hi Andrew,
>>>
>>> 1. Let say I increase the number of primaries in the input file to
>>> 1000000. Then how do I split the jobs?
>>> Should create 5 different input files with different random number and
>>> run it once or run each run (again with different random seed in each) for
>>> 5 cycles?
>>> eg: My input file has 100000 primaries specified. I created 5 different
>>> input files with 5 different random seeds and am running each 5 cycles for
>>> each input file, and am scoring USRBIN every time.
>>>
>>> So at the end of the whole process, I get 5 fort files (from 5 cycles)
>>> for each input file (hence run) and since there are 5 runs = 5* 5 = 25 fort
>>> files.
>>>
>>> Should should be the averaging be done in this scenario over runs or
>>> over cycles?
>>>
>>> Please help.
>>>
>>> Cheers,
>>> Shri
>>>
>>> (Srinidhi Bheesette)
>>>
>>> On 1 March 2017 at 15:26, Andrew Davis <andrew.davis_at_wisc.edu> wrote:
>>>
>>>> Hi Srinidhi
>>>>
>>>> There are a number of issues assuming that your input deck is
>>>> representative
>>>>
>>>> 1) Your START card only contains a single history to run, from a single
>>>> run of 1 primary you cannot make any assertions regarding the results of
>>>> your calculation since you have a large statistical uncertainty. You should
>>>> likely run several million histories with (at least) 5 independent random
>>>> number seeds using the already established tools to perform the averaging.
>>>> 2) You used a USRBIN score (with 1 bin for x-y-z) to determine the
>>>> energy deposition, you might as well use a USRTRACK score, not an issue
>>>> really, but I may’ve chosen a USRTRACK instead
>>>> 3) Your plot doesn’t include any statistical error, its hard judge the
>>>> accuracy of a Monte Carlo calculation without any mention of the
>>>> statistical error.
>>>>
>>>> Thanks
>>>>
>>>> Andy
>>>>
>>>> On Feb 28, 2017, at 4:57 PM, Srinidhi Bheesette <
>>>> srinidhi.bheesette_at_cern.ch> wrote:
>>>>
>>>> Hi all,
>>>>
>>>> I have simulated a pixel detector (just a silicon sensor layer) in
>>>> FLUKA and bombarding it with point neutron source at different energies
>>>> from 1-25.5MHz with a step size of 0.5MHz. I run a single simulation.
>>>>
>>>> I then score the energy deposited in the detector (one value for one
>>>> run) and then plot a graph of the energy deposited on the x-axis the source
>>>> energy on the y-axis shown below:
>>>>
>>>> <image.png>
>>>>
>>>> The energy seems to increase till 20MeV but then start fluctuating from
>>>> 20.5 to 25.5MeV and also a spike at 17MeV
>>>>
>>>> Am I missing some cards in my input file (attached) for activating some
>>>> feature for neutron energies after 20MeV?
>>>>
>>>> Please help.
>>>>
>>>> Cheers,
>>>> Shri
>>>>
>>>> (Srinidhi Bheesette)
>>>> <sensor-22.5MeV.inp>
>>>>
>>>>
>>>>
>>>
>>>
>>
>>
>
>
__________________________________________________________________________
You can manage unsubscription from this mailing list at https://www.fluka.org/fluka.php?id=acc_info
(image/png attachment: image.png)
(image/png attachment: 02-image.png)