Date: Thu, 4 May 2017 09:36:49 +0200
Hello,
Perhaps, this helps to solve the gnuplot error:
http://www.fluka.org/web_archive/earchive/new-fluka-discuss/7366.html
Since *_tab.lis contains the plain ASCII data, you can plot with any other
tool like matplotlib in python. Be careful about the units of the spectrum
as you are scoring a differential spectrum. If the above link solves the
gnuplot problem, I would still recommend to plot with Flair as it can
handle different sorts of normalization.
You are almost right about the columns:
1 and 2 are the lower and upper energy boundaries of the bin
3 values (in your case differential wrt to energy)
4 error in percentage
Cheers,
Nikhil
On Thu, May 4, 2017 at 3:55 AM, Srinidhi Bheesette <
srinidhi.bheesette_at_cern.ch> wrote:
> Hi Eleftherios and Nikhil,
>
> Thanks for your mail.
>
> I followed the steps you mentioned in your mail.
> I used the following scoring card and scored this time in the BIN format:
>
> [image: Inline images 1]
> Using the process option I obtained the sum.lis and tab.lis files.
>
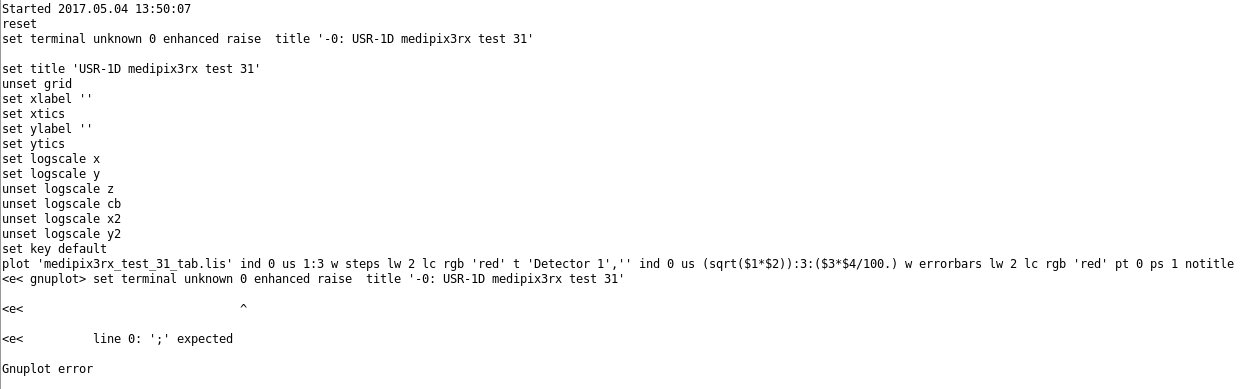
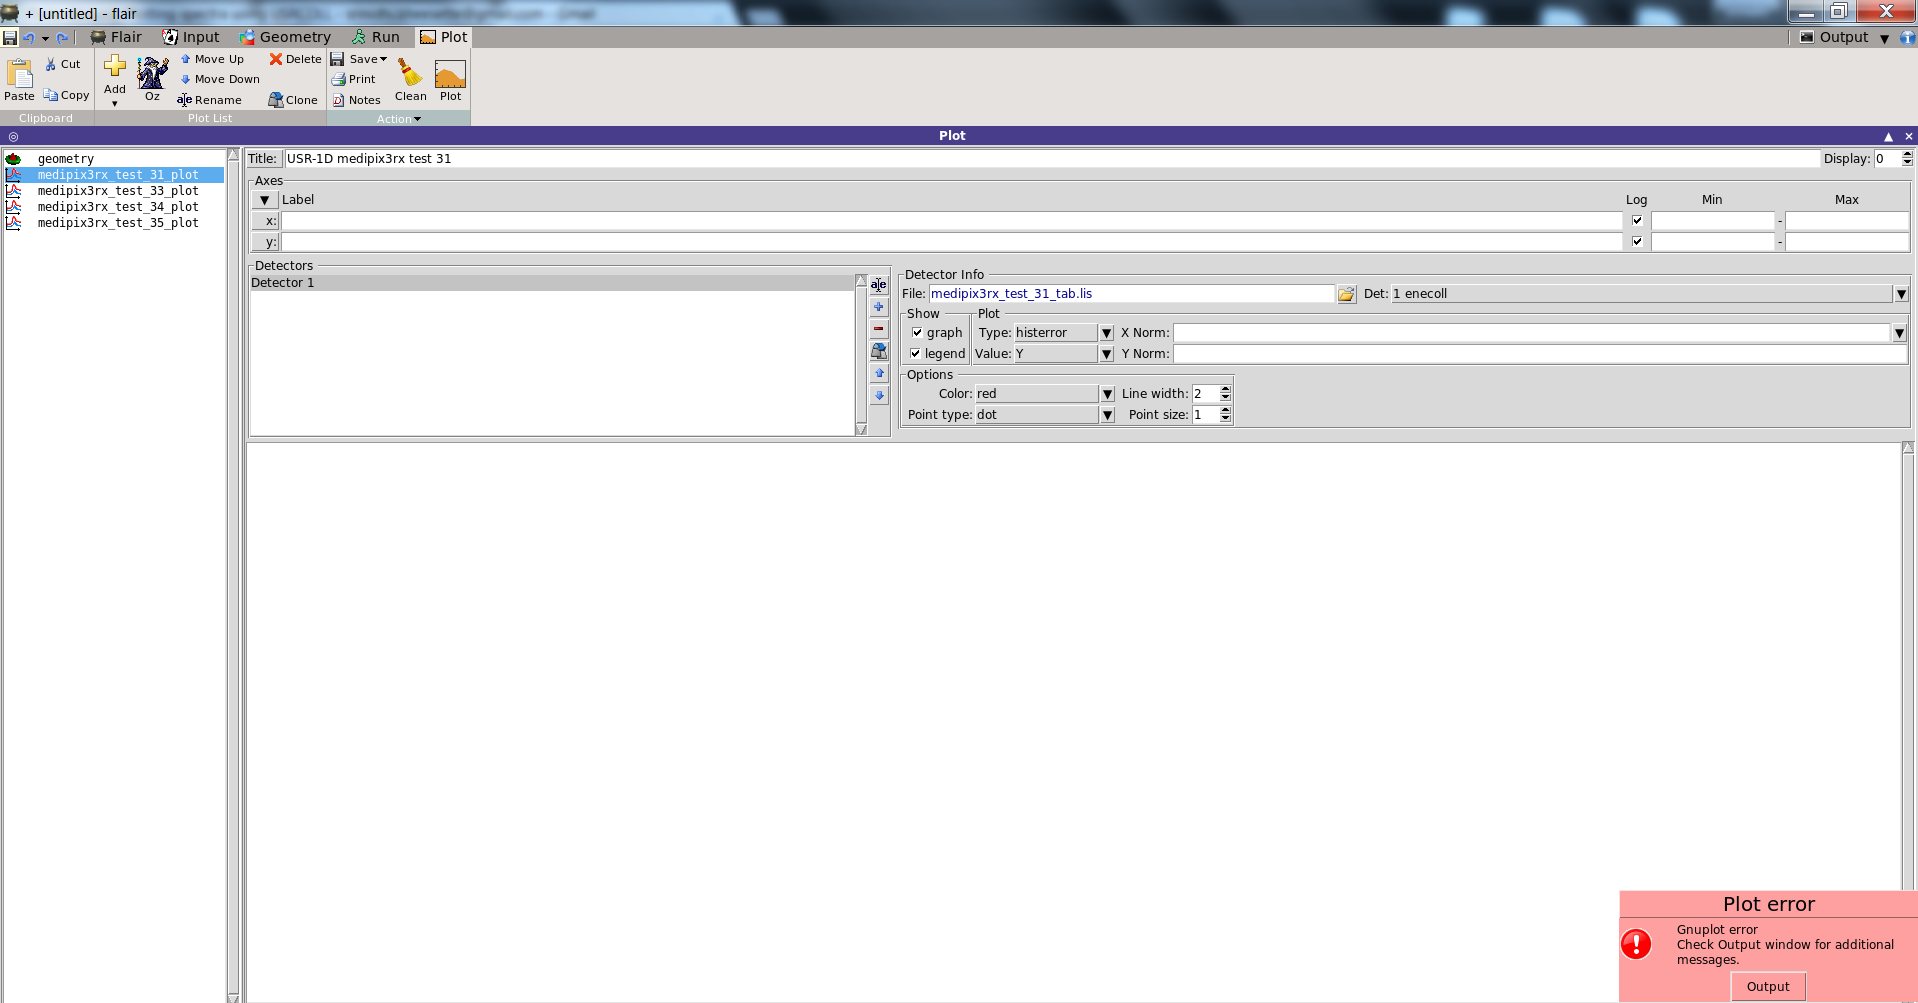
> But I get the following GNUPLOT error when trying to plot using flair.
> [image: Inline images 2]
>
> [image: Inline images 3]
>
> Though the plotting wasn't successful using flair, I downloaded both the
> lis files. (I have attached both the files with this mail)
> Looking at the tab.lis file I assume the first two columns are scoring
> energy range and the third one is the spectra. Does the four column
> represent the error?
>
> Can this be simply plotted using python or does it need any modifications?
> Also could you help be with the GNUPLOT error?
>
> Thanks in advance.
>
> Cheers,
> Shri
>
> (Srinidhi Bheesette)
>
> Cheers,
> Shri
>
> (Srinidhi Bheesette)
>
> On 4 May 2017 at 00:51, Eleftherios Skordis <eleftherios.skordis_at_cern.ch>
> wrote:
>
>> Hi Shri,
>>
>> judging from the file you attached, I think the problem lies in the fact
>> that you have scored in ASCII.
>> As a general approach, one should score in binary format so that you can
>> you are able to use the available FLUKA tools (easily found in flair) to
>> both sum together different runs and cycles for increase statistics as well
>> as the evaluation of the statistical error.
>>
>> Furthermore, as Nikhil suggested you can then use flair to sum and plot
>> the results directly from the "processed" files.
>>
>> Kind regards
>>
>> Lefteris
>>
>>
>>
>>
>>
>> -----------------------
>>
>> Eleftherios Skordis
>> Dep. EN/STI, CERN
>> CH-1211 GENEVA 23
>> SWITZERLAND
>>
>> OFFICE: +41-22-7679541 <%2B41-22-7675461>
>> ------------------------------
>> *From:* owner-fluka-discuss_at_mi.infn.it [owner-fluka-discuss_at_mi.infn.it]
>> on behalf of nikhil shetty [nikhil.nitk_at_gmail.com]
>> *Sent:* 03 May 2017 10:59
>> *To:* Shri Bheesette
>> *Cc:* FLUKA discussion
>> *Subject:* Re: [fluka-discuss]: Plotting spectra using USRCOLL
>>
>> Dear Srinidhi,
>>
>> you should have 5 *fort* files, all of which are in binary format. They
>> cannot be interpreted. You need to merge them and convert them to ASCII
>> format which is readable. It can be easily done via Flair.
>>
>> In Flair, under "Run > Data", click on "Scan" which should automatically
>> select the scoring. Then, click on "Process". Two new files (*_sum.lis and
>> *_tab.lis) should be created, both of which are readable. While *_sum.lis
>> contains average/cumulative quantities, *_tab.lis contains 'plot-able'
>> quantities.
>>
>> To plot, add a USR-1D plot in Flair, and choose the *_tab.lis file.
>>
>> Cheers,
>> Nikhil
>>
>> On Wed, May 3, 2017 at 2:11 AM, Srinidhi Bheesette <
>> srinidhi.bheesette_at_cern.ch> wrote:
>>
>>> Hi all,
>>>
>>> I would like to plot the energy spectrum of alphas and tritium deposited
>>> on a silicon sensor layer after reacting with 6LiF.
>>>
>>> I am using the USRCOLL scoring card to do this:
>>>
>>> [image: Inline images 2]
>>>
>>> The simulations parameters being: 1000000 primaries/cycle and 5 cycles
>>> One of the fort files is attached.
>>>
>>> How do I interpret these files and plot the spectra using them?
>>>
>>> Any help would be appreciated
>>>
>>> Cheers,
>>>
>>> Shri
>>>
>>> (Srinidhi Bheesette)
>>>
>>
>>
>
__________________________________________________________________________
You can manage unsubscription from this mailing list at https://www.fluka.org/fluka.php?id=acc_info

(image/png attachment: image.png)
(image/png attachment: 02-image.png)
(image/png attachment: 03-image.png)

(image/png attachment: 04-image.png)