Date: Thu, 8 Jun 2017 09:12:44 +0000
Hello people sorry for the my confusing explanation.
I have two flair version working (2.2.3 and 2.3.0). The problem is when I try to put USRBIN scoring graph for Dose-EQ, it should overlay the geometry on the top of the Dose-EQ results.
I have managed successfully with flair version 2.2.3. However, I could not manage to do so in flair version 2.3.0.
All the parameters are same. The input files are same as well. The only different is that the version of flair is different.
I enclose the screen shots for showing the differences.
Thank you so much for the help and my apology for the unclear message in the previous email.
Kind regards
Cordialement
David Sangcheol Lee
Research fellow scientist
Radiation protection group,
HSE - Occupational Health & Safety and Environmental Protection unit
CERN- European Organisation for Nuclear Research
Email: david.sangcheol.lee_at_cern.ch
________________________________________
From: owner-fluka-discuss_at_mi.infn.it [owner-fluka-discuss_at_mi.infn.it] on behalf of David Sangcheol Lee [david.sangcheol.lee_at_cern.ch]
Sent: 08 June 2017 09:25
To: fluka-discuss_at_fluka.org
Subject: [fluka-discuss]: no geometry overlay in USRBIN DOSE-EQ plot in flair
Hello FLUKA &FLAIR expert
I try to put cb value maximum of 1000 but I do not know why it shows me the USRBIN plot without geometry. I tried to put everything off and plotting it again. I was only able to plot USRBIN results without having log of cb. However, I do need to put it in log.
I have following message when I put the USRBIN plot
set pm3d map explicit corners2color c1
set palette defined ( 1. 1.0 1.0 1.0, 2. 0.9 0.6 0.9, 3. 1.0 0.4 1.0, 4. 0.9 0.0 1.0, 5. 0.7 0.0 1.0, 6. 0.5 0.0 0.8, 7. 0.0 0.0 0.8, 8. 0.0 0.0 1.0, 9. 0.0 0.6 1.0,10. 0.0 0.8 1.0, 11. 0.0 0.7 0.5, 12. 0.0 0.9 0.2,13. 0.5 1.0 0.0, 14. 0.8 1.0 0.0, 15. 1.0 1.0 0.0,16. 1.0 0.8 0.0, 17. 1.0 0.5 0.0, 18. 1.0 0.0 0.0,19. 0.8 0.0 0.0, 20. 0.6 0.0 0.0, 21. 0.0 0.0 0.0 )
set palette maxcolors 30
set logscale cb
set logscale z
splot '1 year (XY).dat' us 2:1:(($3)*3.6e-06) notitle ,'1 year (XY).geo.dat' ind 0 us 3:4:(0.) w l ls 1 notit
Could anyone help me with this? basically I want the plot overlaying with the geometry
Kind regards
Cordialement
David Sangcheol Lee
__________________________________________________________________________
You can manage unsubscription from this mailing list at https://www.fluka.org/fluka.php?id?c_info
__________________________________________________________________________
You can manage unsubscription from this mailing list at https://www.fluka.org/fluka.php?id=acc_info
(image/png attachment: aboutpage2.3.0.png)
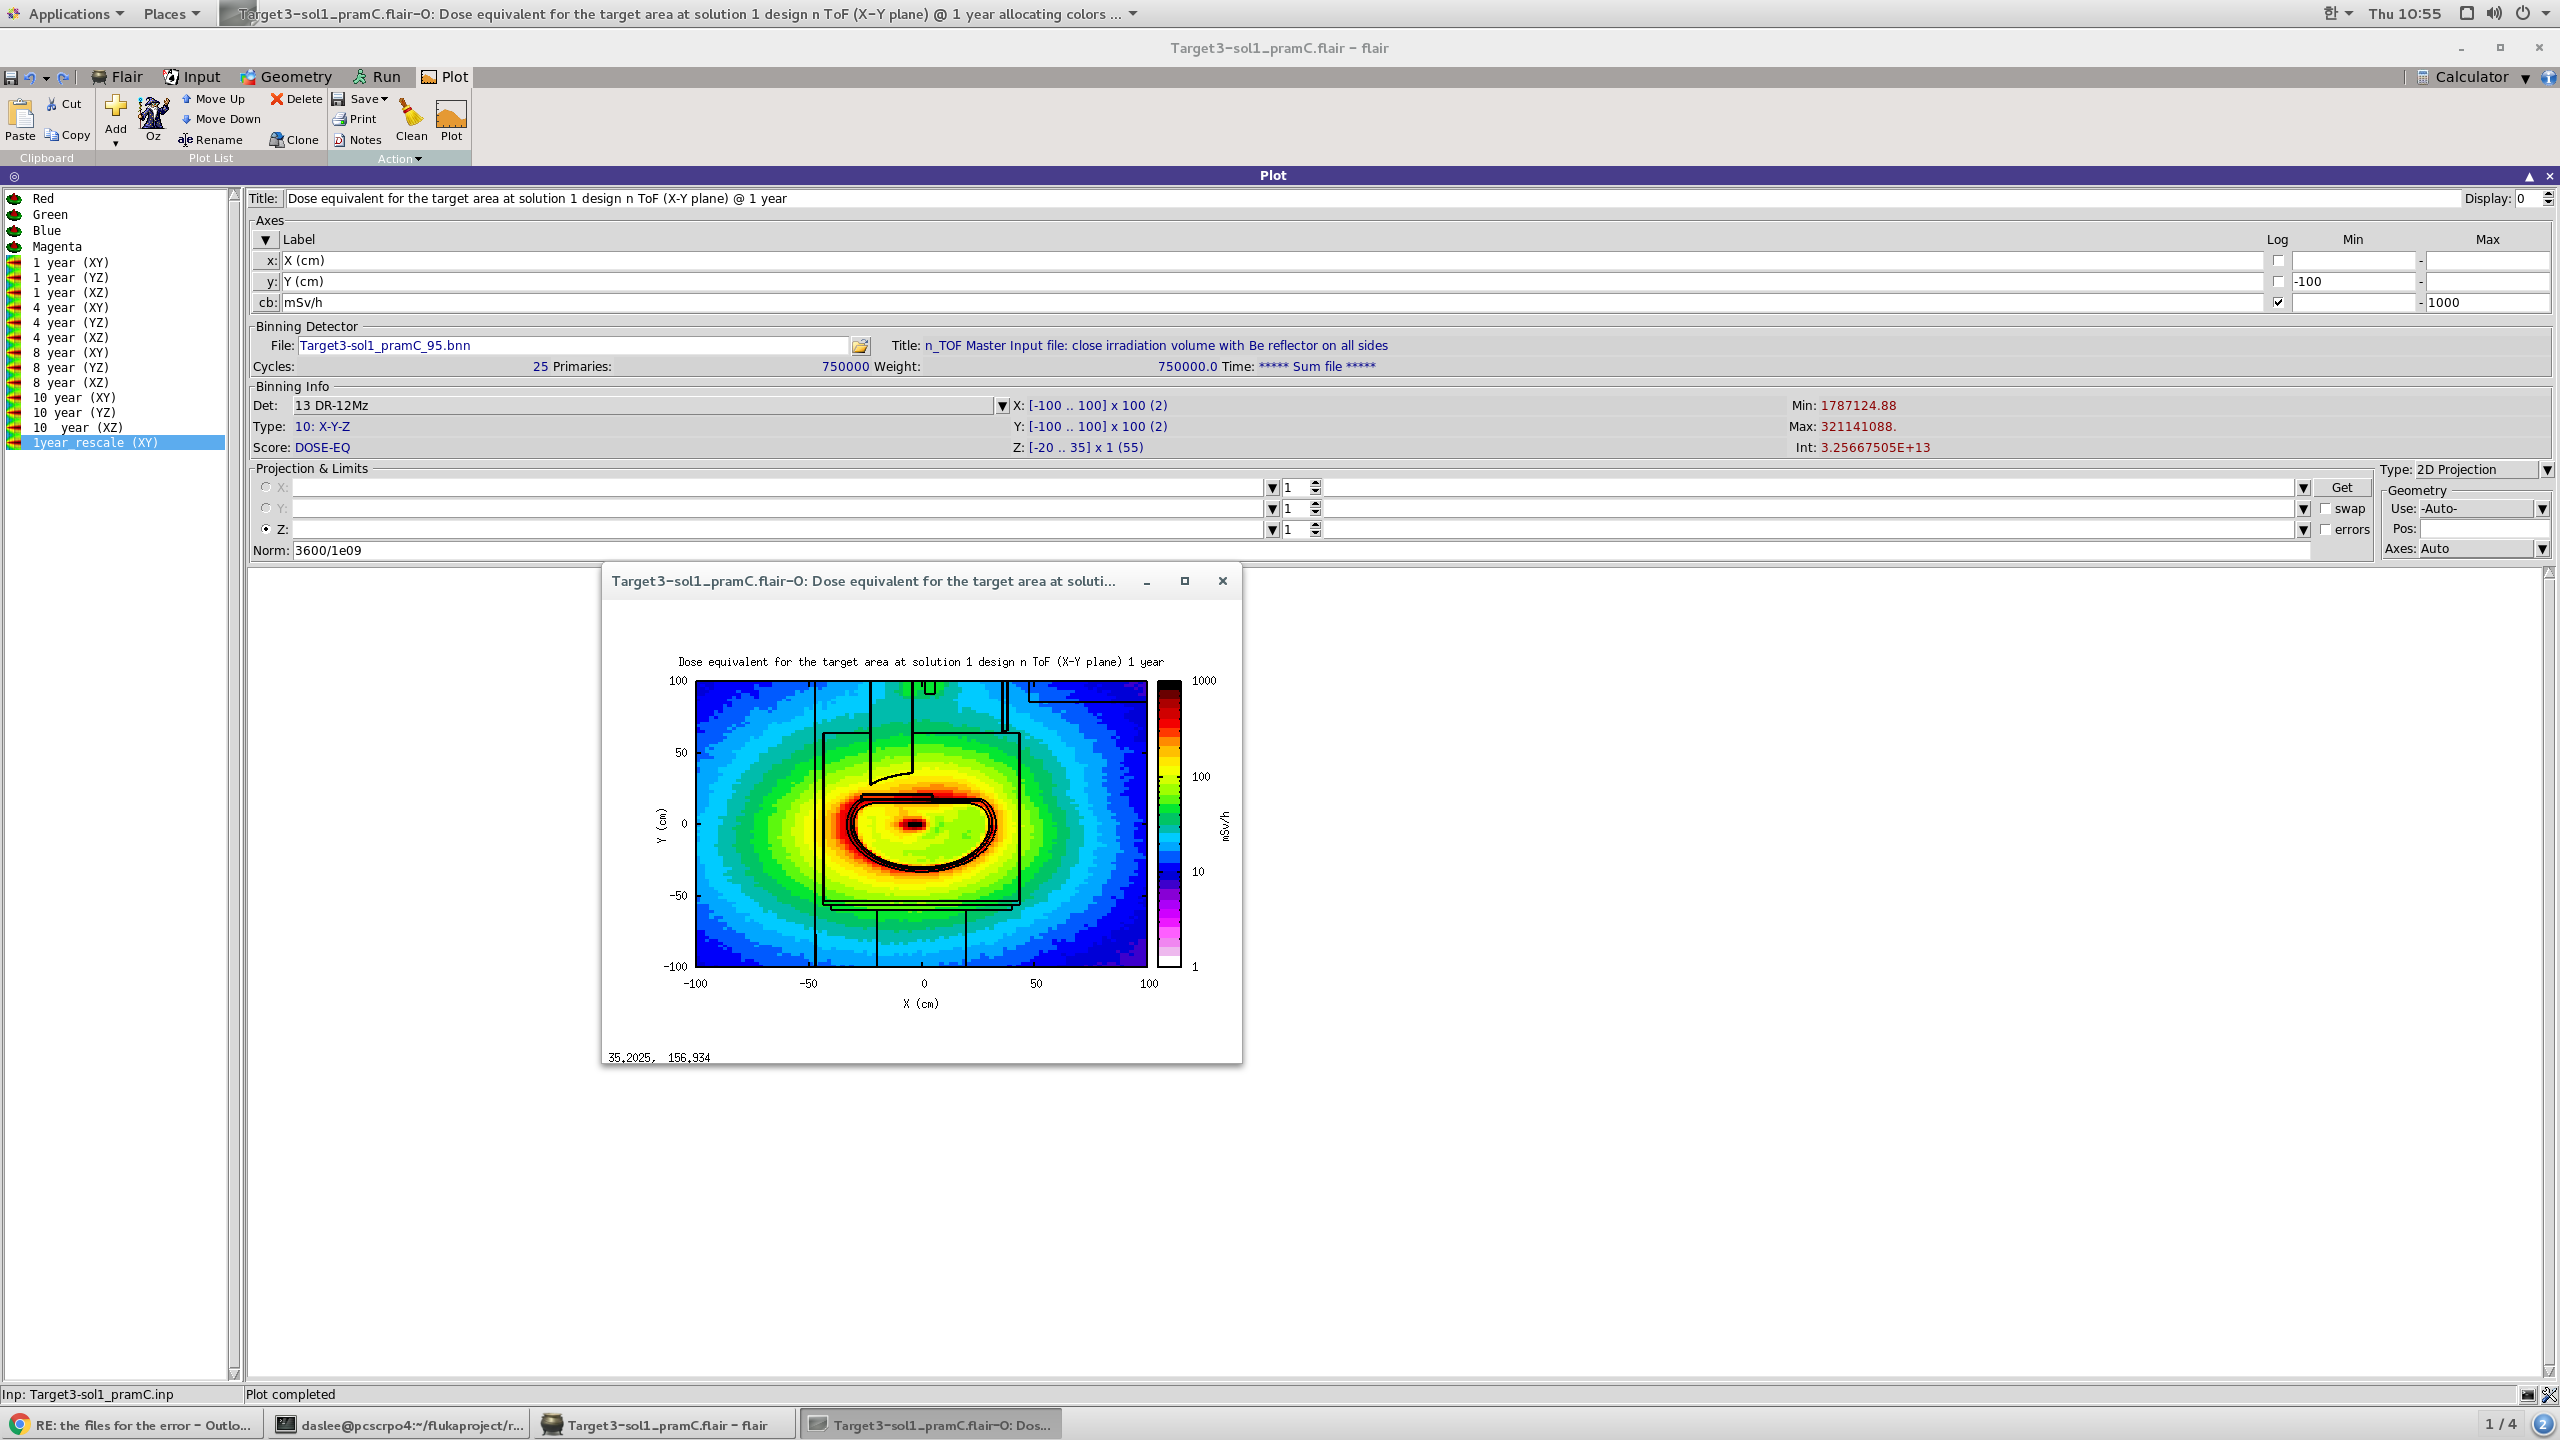
(image/png attachment: version2.2.3.png)
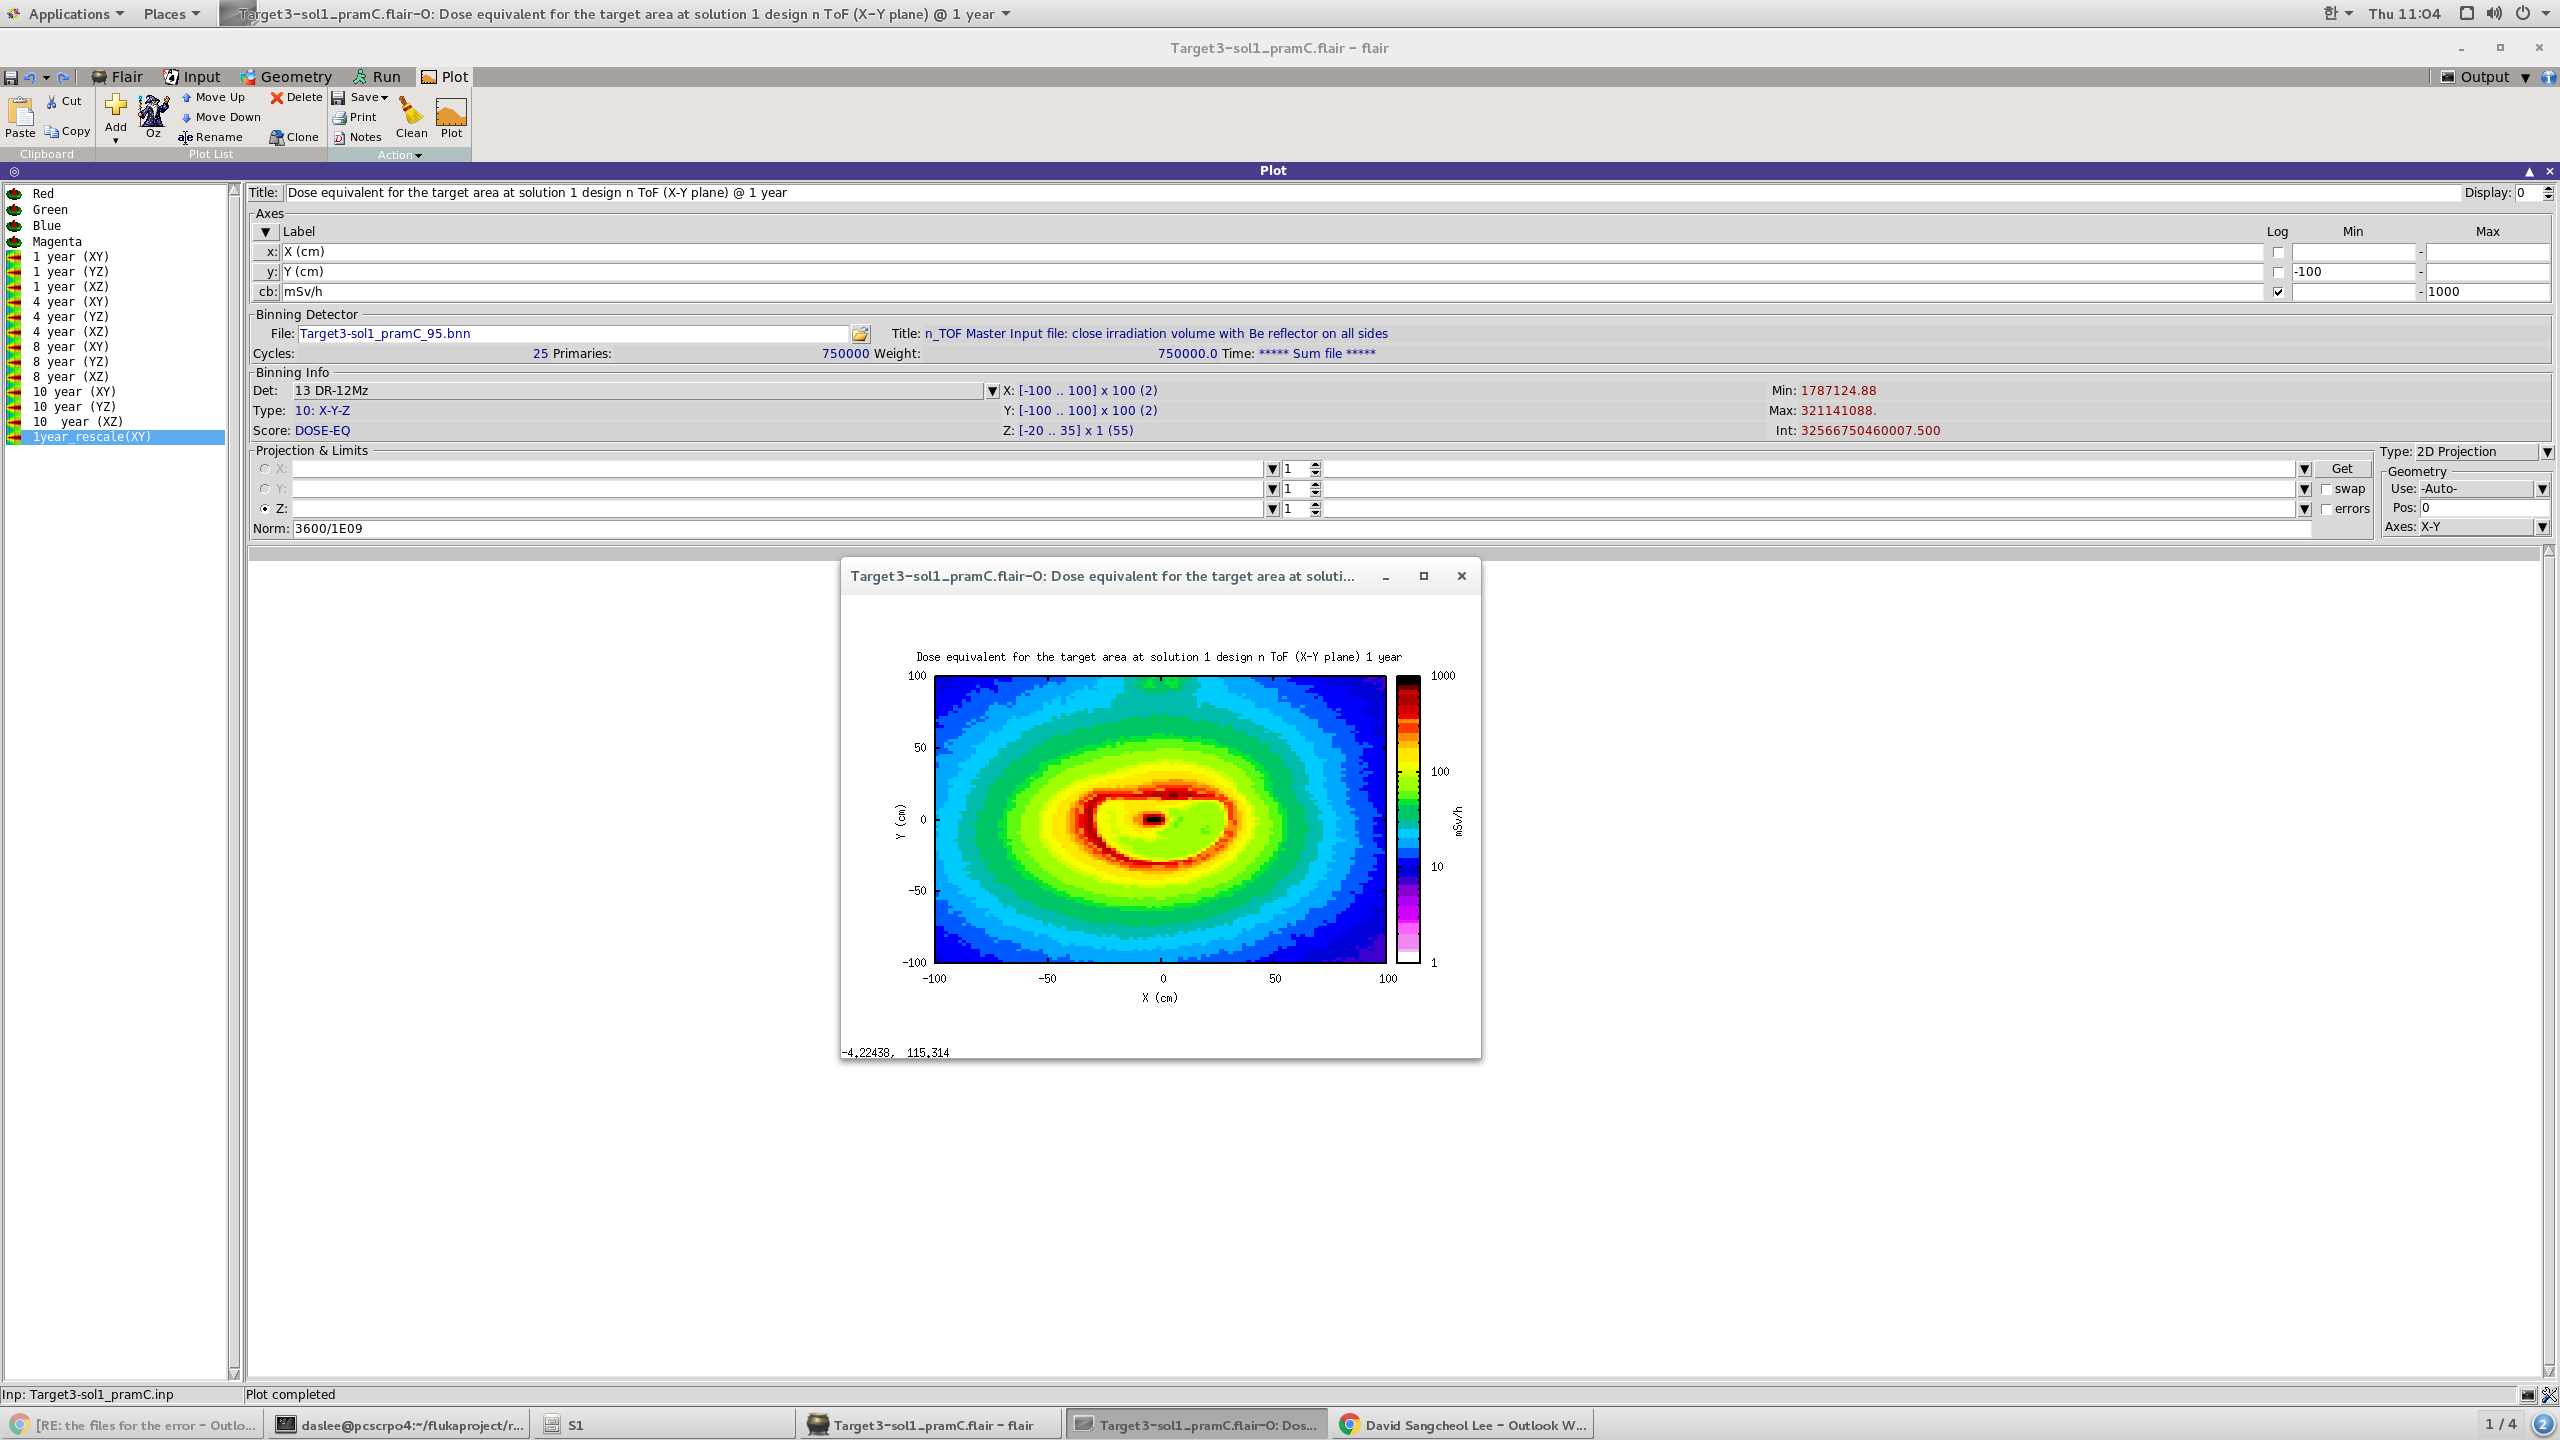
(image/png attachment: version2.3.0.png)