Date: Tue, 18 Aug 2009 12:29:29 +0200
Dear all,
I used the FLUKA input card that you find in attachment to simulate the
energy loss of 120 GeV pions in 450 microns of silicon.
Being new to all this, I would appreciate if someone with more
expertise could check that this procedure is indeed correct (are the
default cut-offs right for such a thin layer, etc.).
I analysed the FLUKA output file with some FORTRAN and C++/ROOT code I
found on the mailing list. Thus, I pick up the event-by-event energy
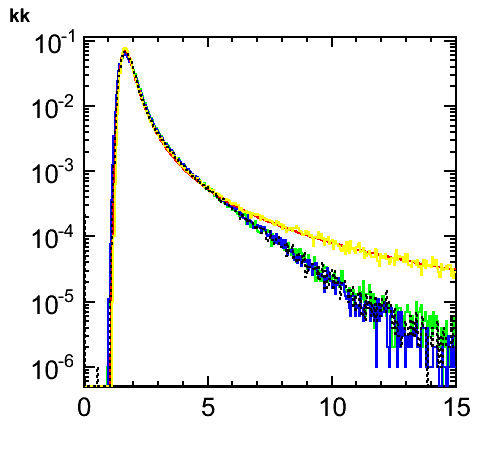
deposition in the different regions. In the attached figure I compare
the resulting "Landau" distribution to several other models. I
normalized all histograms. I scaled the X-axis to ADC counts for our
detector (i.e. consider them arbitrary units).
The yellow line is FLUKA. The red line is a prediction by Hans
Bichsel's convolution method. These agree perfectly over the full range.
The remaining lines are different GEANT4 setups (I tried to run
with/without PAI model, with different step sizes, with/without nuclear
interactions, adding the energy of escaping delta-electrons). The result
is not affected very much by these choices and the high energy tail is
ALWAYS incompatible with the Bichsel/FLUKA result.
Are the Bichsel/FLUKA results really independent, or is the underlying
model the same?
Does anyone know why GEANT4 and FLUKA yield different predictions? Have
the two been compared in the past?
Which is the correct curve? Has the FLUKA curve been compared to data?
Regards, Marcel
PS I posted the same question to the GEANT4 authors.
- chemical/x-gamess-input attachment: my.inp