Date: Tue, 13 May 2014 17:20:07 -0700
Hello everyone,
I have an inconsistency which I have not been able to resolve.
I score deposited energy distribution using USRBIN and plot the 2-D or
the 1-D projections and extract the corresponding data files.
If I plot the 2-D projection, deposited energy is averaged in the third
dimension (over the chosen slice, if any), so to get the total deposited
energy in some region, I would need to multiply the value in a given bin
by the slice width and the widths of the bin for that value, correct?
And if I plot the 1-D projection, deposited energy is averaged in the
other two dimensions (over the slices I have chosen), so to get the
total deposited energy in some region, I would need to multiply the
value in a given bin by the width of the bin and widths of the slices in
the other two dimensions.
I am looking at the power deposition in the entrance and exit windows
(0.013 cm or 130 microns, so very thin) of a Rb target. The windows are
discs with a radius of 1.35 cm. The beam is 110.5 MeV protons.
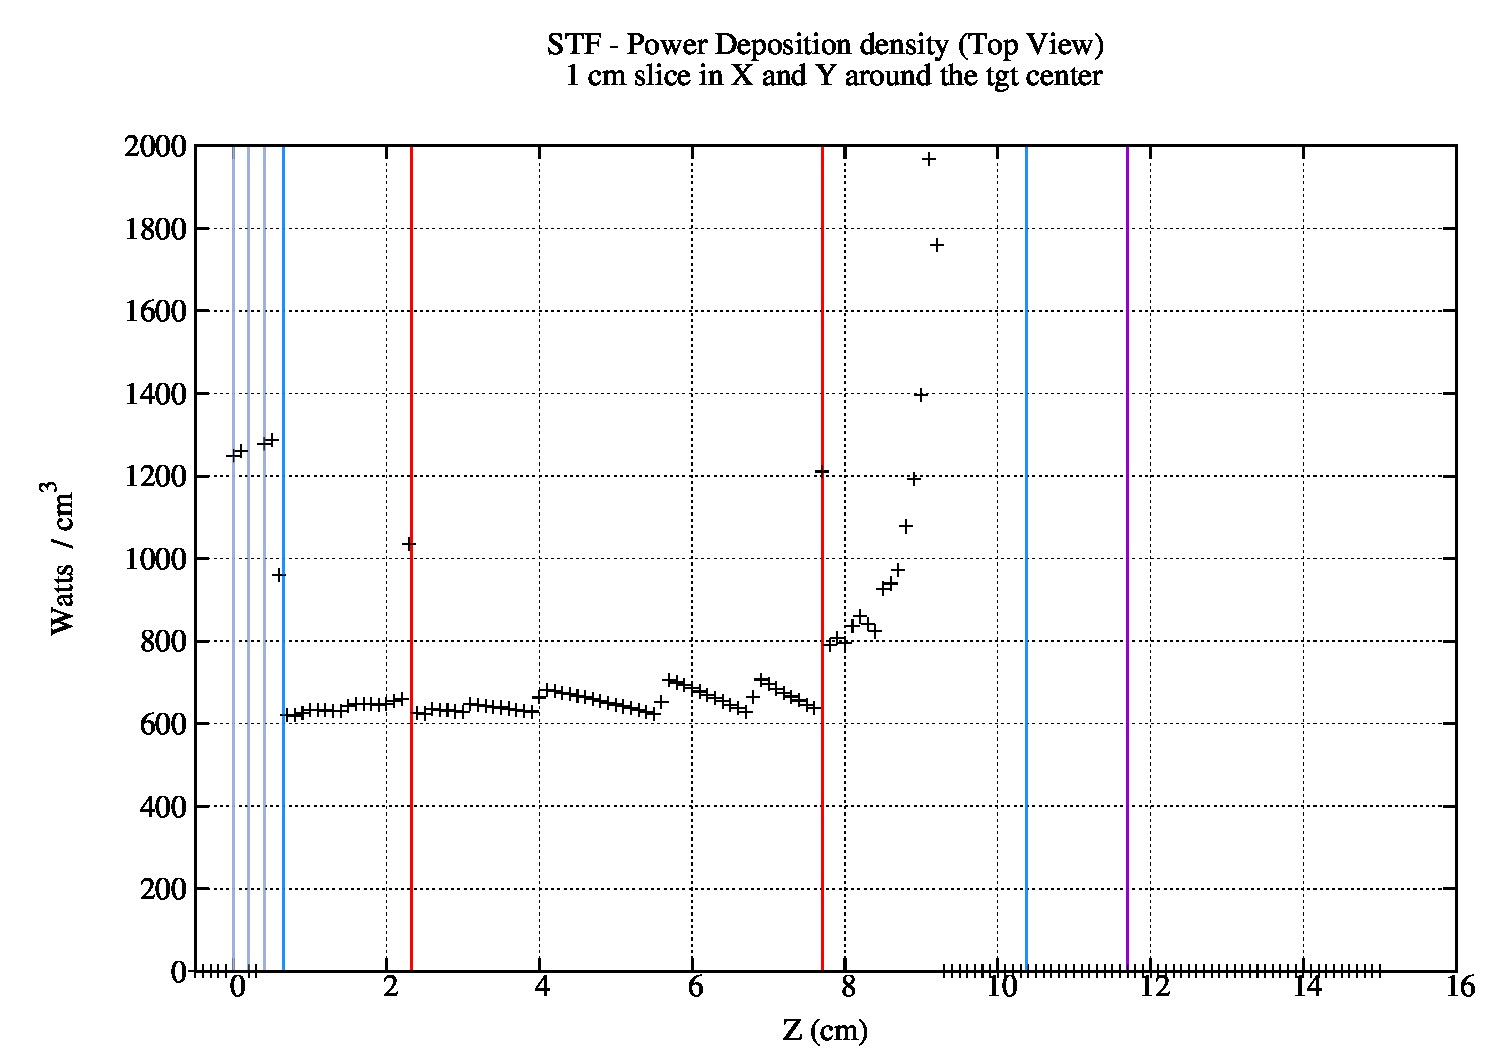
I look at the 1D projection of the deposited energy as a function of
depth or Z (i.e. longitudinal direction or direction of the beam). I
choose a 1 cm slice in X and Y. I am attaching the figure
(STF-PD_TopView_Z_lin.jpg). Results are based on 200 M primaries. The
red lines are drawn at the entrance and exit windows and the Rb target
sits in B/N. Bin width is 1 mm. I can see the Bragg peak in the water
but do not understand the 'saw-thooth or step-like behaviour' of the
energy deposition inside the target region. I see the same behavior if
I look at the proton fluence as a function of proton energy inside the
target (can send out that figure if anyone is interested).
Suppose I wanted to find the total deposited energy in the upstream
window. So I take the value at the first red line (entrance window),
i.e. 1034.5 Watts/cm^3 and multiply it by (1cm x 1cm x 0.1 cm) = 103.45
Watts.
But when I look at the output files for total deposited energy in
different volumes, I see: 58.34 Watts in the upstream window. The
reason I am off here by almost a factor of two has to do with the coarse
USBRIN binning, i.e. 1mm in the Z direction (while the window thickness
is 0.13 mm) so I am looking at a larger volume than the volume of the
window.
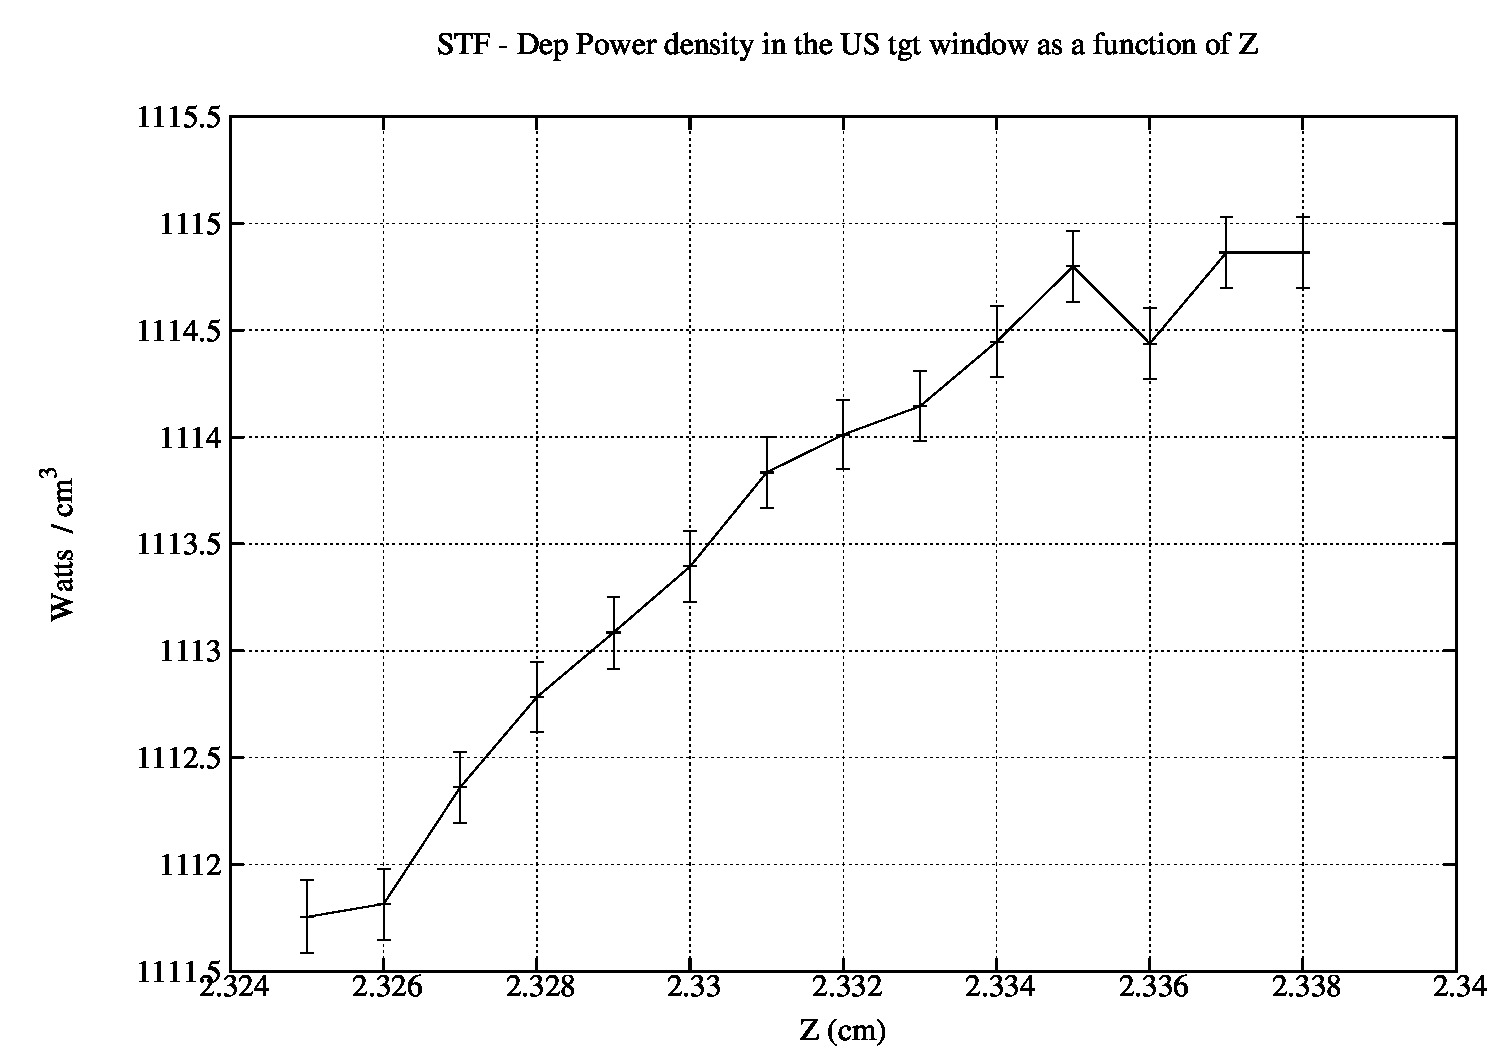
I defined another usrbin card with finer binning along Z (0.001 cm bin
size) in the upstream window region. X and Y slices are still 1 cm wide
each. I set the max. step size to 0.01 cm. I plot the 1D projection as
a function of Z. I have attached the figure (STF-PD_usW_Z.jpg).
So in principle, I should be able to add up all the values in the data
file from the 1-D projection, multiply the total by (0.013) and get the
total energy deposition in the upstream window (or close to it -
cylindrical binning would have been a better choice). The slice widths
in X and Y are both 1 cm. I get 203 Watts! So I am not converging to
the total energy deposition I see via the simple SCORE card (58.34 Watts).
Am I doing something wrong?
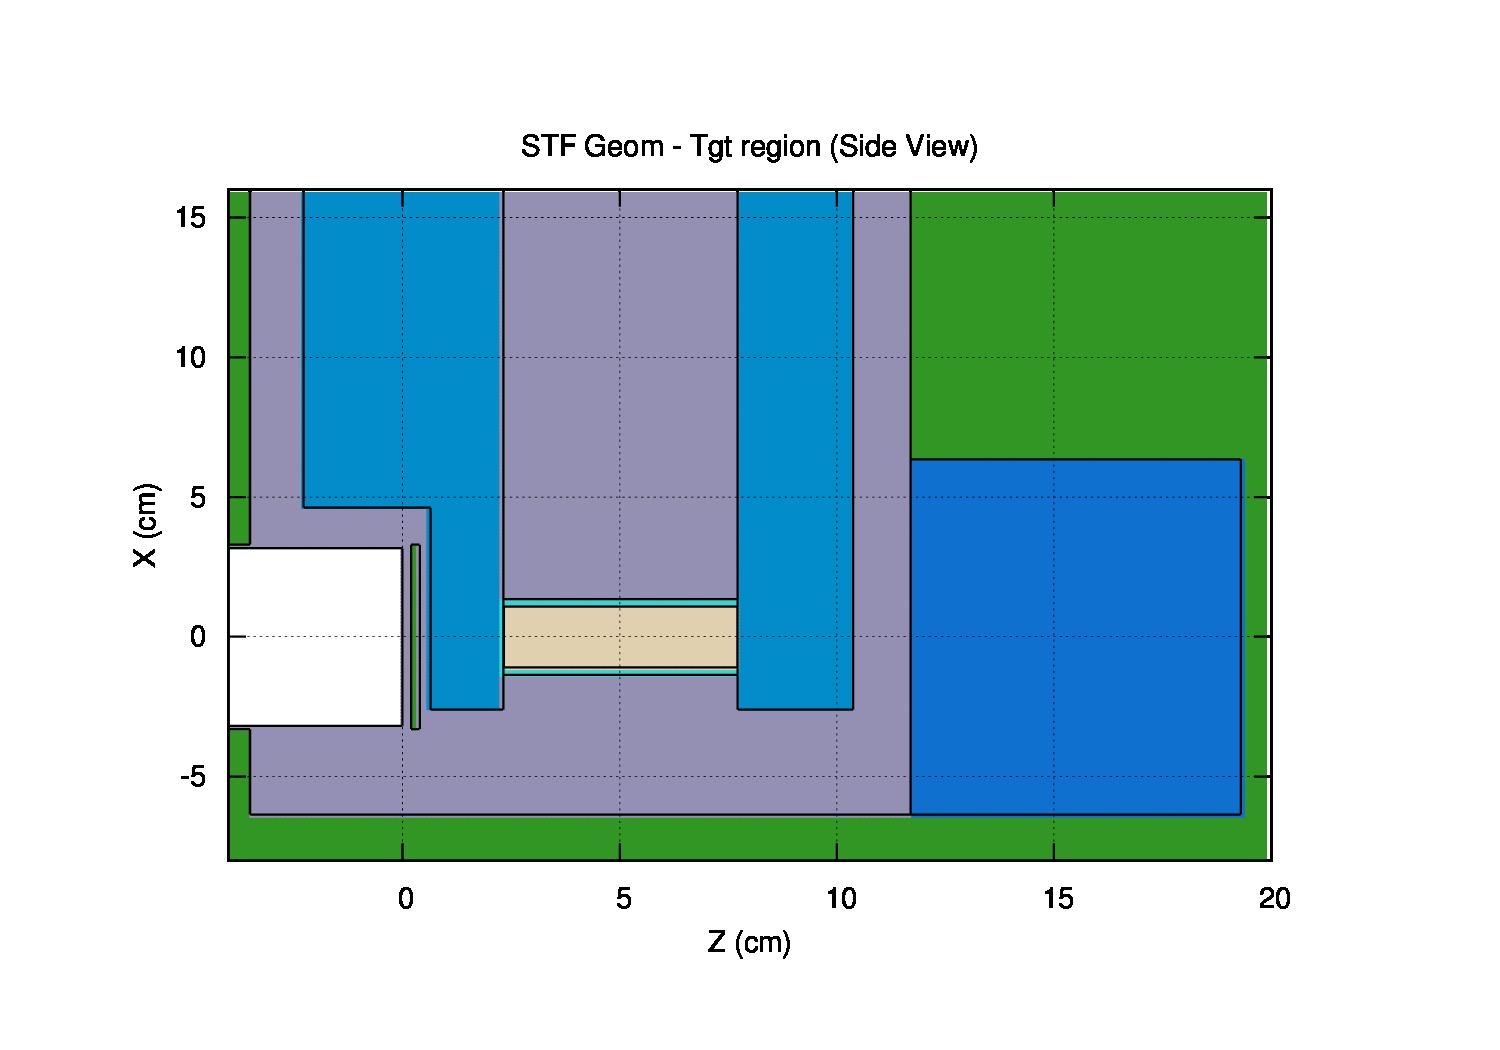
I am also attaching a side-view of the geometry showing target region.
From left to right, you'll see the beam pipe, the beam pipe exit
window, air gap, water jacket entrance window, water, target entrance
window (too thin to see), target, target exit window (too thin to see),
Target container box, Graphite.
Thanks and best wishes,
Mina
(image/jpeg attachment: STF-PD_TopView_Z_lin.jpg)
(image/jpeg attachment: STF-PD_usW_Z.jpg)
(image/jpeg attachment: STF_Geom_xz_view2.jpg)