Date: Mon, 5 Oct 2015 03:44:17 +0000
dear Fluka experts,
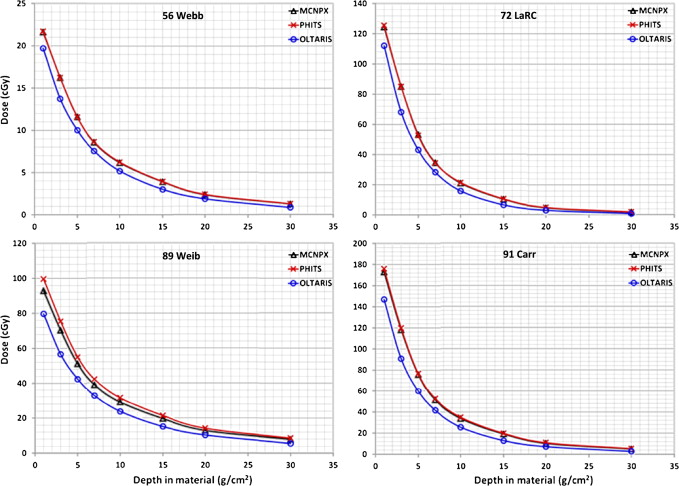
I am trying to reproduce dose vs thickness plots (fig. 9) from this paper:
http://ac.els-cdn.com/S2214552414000674/1-s2.0-S2214552414000674-main.pdf?_tid=da0edce4-6b08-11e5-9aee-00000aacb35e&acdnat=1444012326_4af718919e1084ee88a6f9804eb72a47
I am using USRBIN estimator with Nx=Ny=1 and looking at 1D projection to get dosage profile inside water slab.
The result of USRBIN is GeV/g per primary weight so to convert it to Gy I multiply it by 1.602e-7 conversion factor as explained in note 5 of USERBIN in manual.
Then, to get rid of primary, I multiply the result by normalization factor as was explained to me by Mikhail in this thread:
http://www.fluka.org/web_archive/earchive/new-fluka-discuss/8269.html
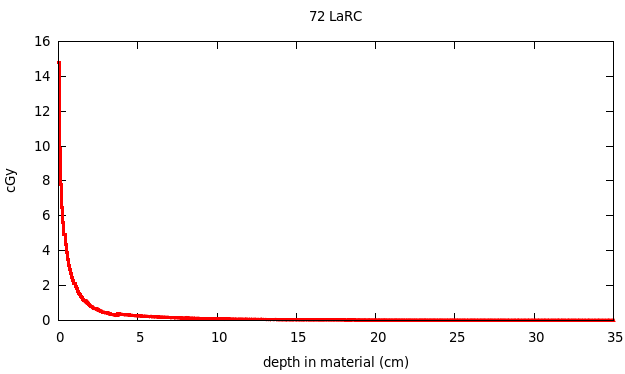
The problem is that the curve I am getting is too steep compared to fig. 9:
[cid:be5cf39c-6fb4-492e-bf28-2ed1ba302528]
I'm trying to simulate the "72 LaRC" one (in the top right corner)
what Im getting:
[cid:c8c55ac2-fb70-4d81-9800-ac096cdd8991]
I am confident that the source is modeled correctly since it's profile matches one in the paper (fig. 1)
Can you please point me at what I am doing wrong?
I know there are other ways to obtain dose like fluence-to-dose conversions, specifically Stefan Roesler's FLUSCW routine but I would like to know how to use USRBIN first.
thank you,
Roman
__________________________________________________________________________
You can manage unsubscription from this mailing list at https://www.fluka.org/fluka.php?id=acc_info
(image/png attachment: pastedImage.png)
(image/png attachment: 02-pastedImage.png)
- application/gzip attachment: Aghara.tar.gz