Date: Mon, 1 Feb 2016 04:13:12 +0000
dear Fluka experts,
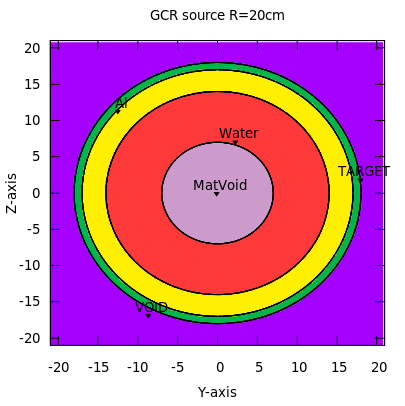
I am trying to calculate dose values at various depths in spherical hollow water shielded by aluminum layer subject to spherical GCR source:
[cid:c057b07c-11f4-4a52-899c-b618994e6736]
here MatVoid inside and VOID outside are vacuum. GCR source sphere (not shown) is of 20 cm radius.
What I expected to get is an exponential decay of dose values starting from outer layers of the water sphere toward inner layers demonstrating shielding property of aluminum and water, something similar to figure 9 here:
http://www.sciencedirect.com/science/article/pii/S2214552414000674/pdfft?md5=fa5b5ee5f3679917a4686acc3af31fc7&pid=1-s2.0-S2214552414000674-main.pdf
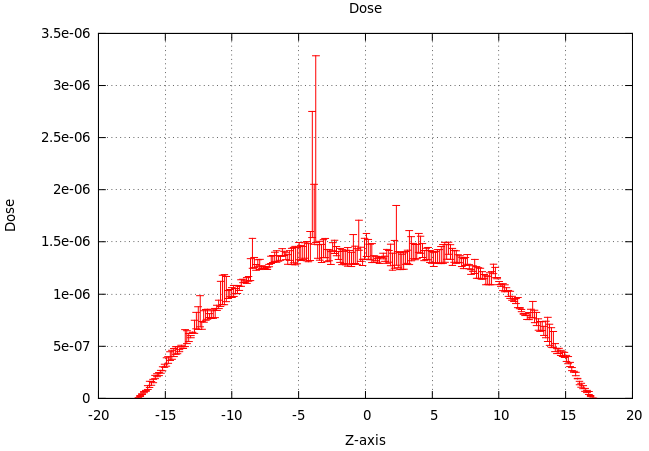
But what I do get is completely opposite. Dose increases from outer layers inward reaching maximum inside the vacuum void:
[cid:8e195e9c-72d3-41d1-86cb-fe9ab4beb8d5]
What is the difference between figure 9 and what I am doing?
How do I obtain a trend as in the figure 9?
Thank you,
Roman
__________________________________________________________________________
You can manage unsubscription from this mailing list at https://www.fluka.org/fluka.php?id=acc_info
(image/png attachment: pastedImage.png)
(image/png attachment: 02-pastedImage.png)
- application/gzip attachment: test_sphere.tar.gz