Date: Fri, 13 May 2016 05:53:20 +0000
Dear Dr. Vittorio,
Thanks for your mail.
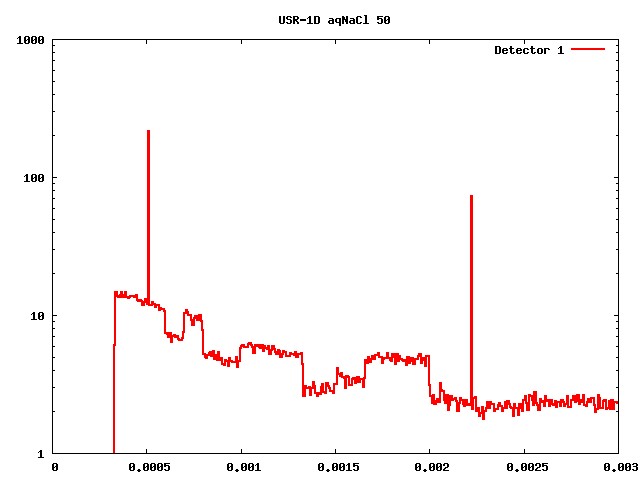
I am attaching the input file and the plot.
Prompt gamma response of aq.NaCl solution (26 wt% ) for a 1 keV neutron beam is scored using USRTRACK.
If I compare the simulation as well as the experimental spectrum (neutron source is not mono energetic in the experimental case) , the simulated peaks are broader than the experimental peaks at 788 keV, 1.16 MeV and 1.95 MeV. However 511 keV and 2.2 MeV prompt gammas are narrow peaks.
But later we found that " gamma generation by low-energy neutrons (but not gamma transport) is treated in the frame of a multi group scheme too,
with the exception of a few important gamma lines, such as the 2.2 MeV to calculate the fluence of different radiation fields. transition of Deuterium and the 478 keV photon from 10B(n,alpha) reaction...." from the FLUKA manual. Is this the reason for a broader peaks?
So how can I compare a FLUKA simulated prompt gamma spectrum with that obtained experimentally?
Thanks and Regards,
Priyada
________________________________
Dear Priyada, it's difficult to understand from your explanation the geometry and size of your simulation, as well as the physics thresholds and options you activated.
In addition the picture you attach only includes simulation and RIPL-3 evaluation.
It would be helpful if you could send your input file.
Best,
Vittorio
Sent from my iPad
On 02 mag 2016, at 06:46, Priyada P [MU-MCNS] <priyada.p_at_manipal.edu<mailto:priyada.p_at_manipal.edu>> wrote:
Dear FLUKA experts,
I am trying to simulate a prompt gamma spectrum from aqueous NaCl due to mono energetic neutron beam of energy 1 keV . The gamma peaks of interest are 511 keV, 788 keV, 1.16 MeV, 1.95 MeV and 2.2 MeV (as per PGAA data base ).
The spectrum is scored using USRTRACK option (Emin 60 keV Emax 3 MeV 100 bins).
However, on comparison with the experimental results, simulated spectrum found to be broader . As it is seen in the below Figure, peaks are having a width of approximately 0.4 MeV . The gamma peaks observed at 511 keV and 2.2 MeV peaks are narrow peaks though. A comparison of RIPL-3 database of 36Cl* decay is also compared in the Figure. RIPL-3 yield is given as Probability that a level decays through the given gamma-ray emission. It is the ratio of the total electromagnetic decay of the level to the intensity of the gamma-ray.?
Can someone help me to resolve this problem by suggesting the database which is considered in the FLUKA simulations, if its not RIPL-3.
What can be the reason behind this difference?
Thanks,
Priyada,
Post Doctoral Research Fellow,
Manipal Centre for Natural Sciences,
Manipal University
<pastedImage.png>
__________________________________________________________________________
You can manage unsubscription from this mailing list at https://www.fluka.org/fluka.php?id=acc_info
(image/jpeg attachment: aqNaCl_50_plot.jpg)
- chemical/x-gamess-input attachment: aqNaCl.inp