Date: Tue, 7 Mar 2017 12:04:28 +0100
Dear fluka users,
I am interested in sampling the current (not the flux) of muons and
muonic neutrinos passing trough a surface, perpendicular to the z-axis.
The two regions touching at the surface are called "CONCFWD" and "MUABS1".
I am interested in studying the current dependence on the particles
energy, theta angle, and position on the surface.
In my input file, I have two USRBDX cards:
First card:
USRBDX -1. NEUTRIM -50. CONCFWD MUABS1 1.numu
USRBDX 11.0 0.01 200.0 0.2 0.0 400. &
Second card:
USRBDX -1. MUONS -52. CONCFWD MUABS1 muons
USRBDX 11.0 0.01 200.0 0.2 0.0 400. &
USRBDX is not giving me any position information, thus I dediced to use
the fluka user routines to manually score the current. In my mdgraw
file, the relevant lines of the BXDRAW entries are:
c This is exiting-from region
CALL GEOR2N(MREG,REGNAME,IREGERR)
c This is entering-to region
CALL GEOR2N(NEWREG,REGNAME2,IREGERR2)
c Check particles
if ((REGNAME.eq.'CONCFWD').and.(REGNAME2.eq.'MUABS1')) then
CALL treefill(NCASE,JTRACK,2,ETRACK,CXTRCK,CYTRCK,CZTRCK,
& XSCO,YSCO,ZSCO,WTRACK,WSCRNG)
endif
"treefill" is a routine that records those variables in a ROOT TTree,
where every entry refers to a single particle crossing the surface.
I am comparing the results of the USRBDX built-in scorer with what I get
from the manual scoring. I am just focusing on the differential current
wrt the particle energy.
-> First, I process the simulation output data (using FLAIR interface)
to produce the output plot for the USRBDX scorer
-> Then, I process the ROOT TTree. I create an histogram that is equal
to the USRBDX output in terms of binning, and for each entry in the ROOT
TTree I fill this histogram with the energy, with a weight equal to
WSCRNG (but the same conclusions apply If I use WTRACK instead of WSCRNG).
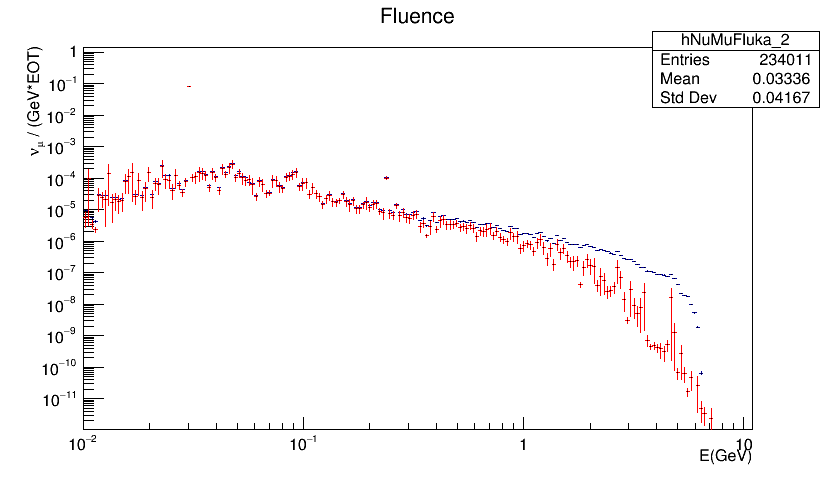
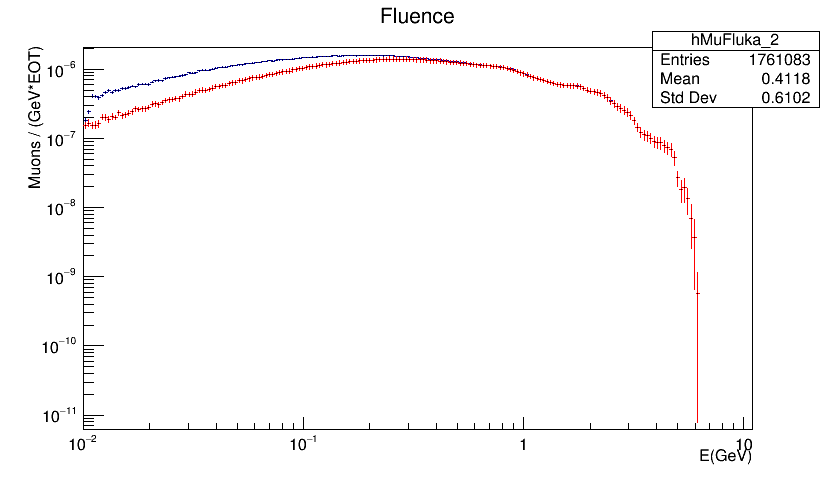
I attach two plots showing the comparison for muons and for muonic
neutrinos. Fluka built-in is RED, while manual scoring is BLACK. Plots
are normalized to the number of primary particles and to the each bin width.
As you see, the two plots (built-in VS manual) are the same just in a
given energy range (low-energy for neutrinos and high-energy for muons),
while there're significant discrepancies at high energy for neutrinos
and at low energy for muons.
Am I missing something important in doing the manual scoring?
* Since I am scoring a current, I do not have to include angular factors
* Is it possible that I am missing the correct precision in writing the
numbers (especially the weights) to the ROOT TTree?
* Is there any other weight that I need to take into account?
Thanks!
Andrea
__________________________________________________________________________
You can manage unsubscription from this mailing list at https://www.fluka.org/fluka.php?id=acc_info
(image/png attachment: neutrinoComparison.png)
(image/png attachment: muonComparison.png)