Date: Thu, 4 May 2017 13:55:27 +1200
Hi Eleftherios and Nikhil,
Thanks for your mail.
I followed the steps you mentioned in your mail.
I used the following scoring card and scored this time in the BIN format:
[image: Inline images 1]
Using the process option I obtained the sum.lis and tab.lis files.
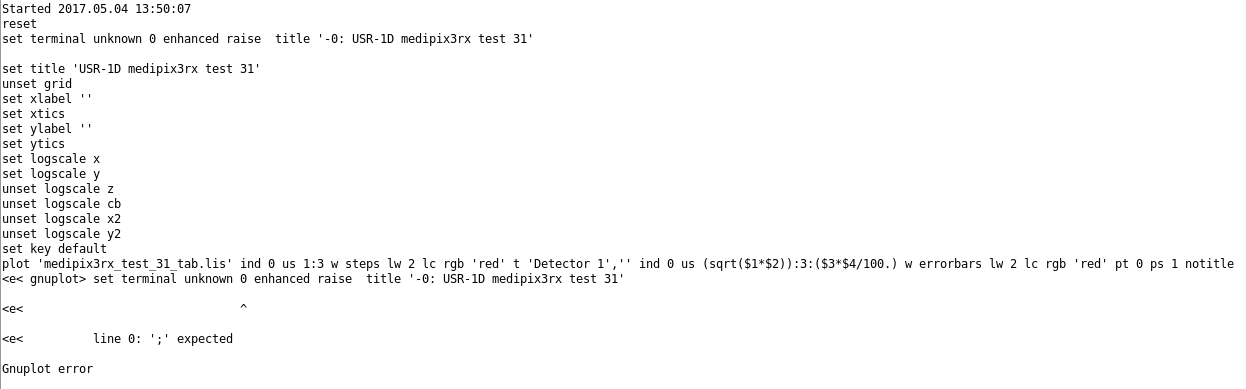
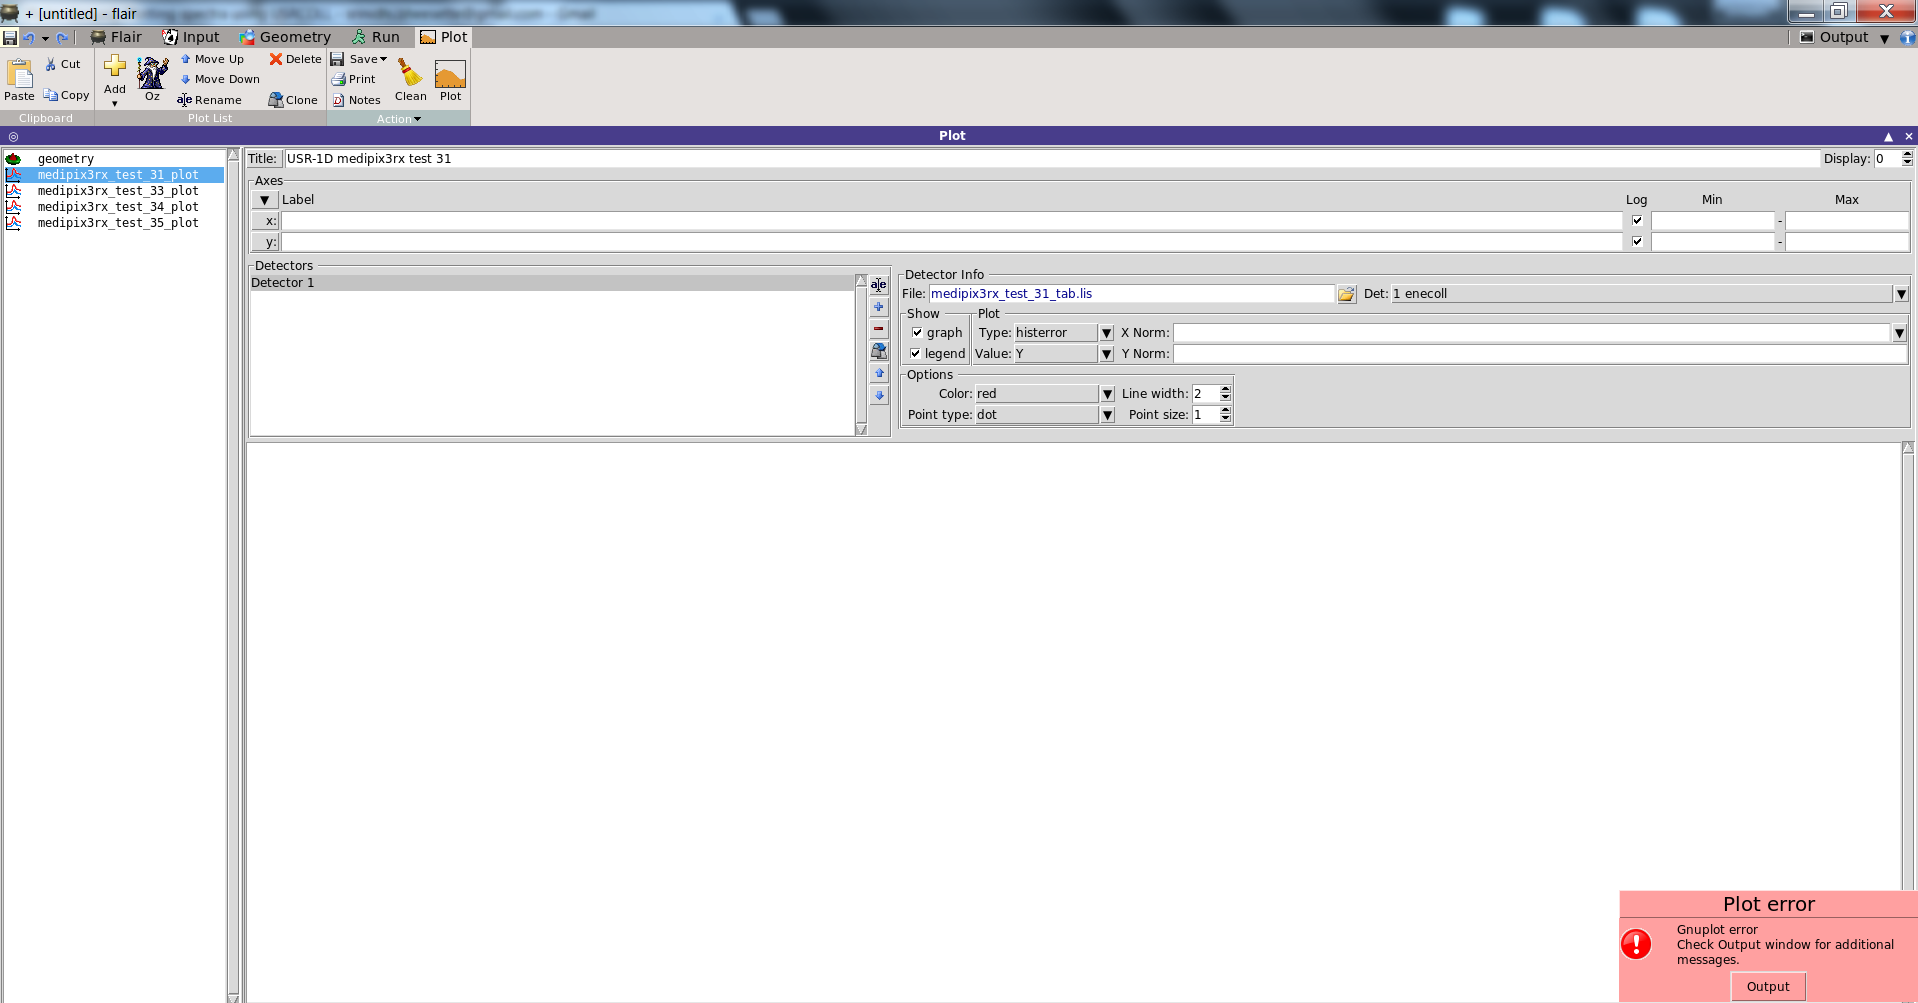
But I get the following GNUPLOT error when trying to plot using flair.
[image: Inline images 2]
[image: Inline images 3]
Though the plotting wasn't successful using flair, I downloaded both the
lis files. (I have attached both the files with this mail)
Looking at the tab.lis file I assume the first two columns are scoring
energy range and the third one is the spectra. Does the four column
represent the error?
Can this be simply plotted using python or does it need any modifications?
Also could you help be with the GNUPLOT error?
Thanks in advance.
Cheers,
Shri
(Srinidhi Bheesette)
Cheers,
Shri
(Srinidhi Bheesette)
On 4 May 2017 at 00:51, Eleftherios Skordis <eleftherios.skordis_at_cern.ch>
wrote:
> Hi Shri,
>
> judging from the file you attached, I think the problem lies in the fact
> that you have scored in ASCII.
> As a general approach, one should score in binary format so that you can
> you are able to use the available FLUKA tools (easily found in flair) to
> both sum together different runs and cycles for increase statistics as well
> as the evaluation of the statistical error.
>
> Furthermore, as Nikhil suggested you can then use flair to sum and plot
> the results directly from the "processed" files.
>
> Kind regards
>
> Lefteris
>
>
>
>
>
> -----------------------
>
> Eleftherios Skordis
> Dep. EN/STI, CERN
> CH-1211 GENEVA 23
> SWITZERLAND
>
> OFFICE: +41-22-7679541 <%2B41-22-7675461>
> ------------------------------
> *From:* owner-fluka-discuss_at_mi.infn.it [owner-fluka-discuss_at_mi.infn.it]
> on behalf of nikhil shetty [nikhil.nitk_at_gmail.com]
> *Sent:* 03 May 2017 10:59
> *To:* Shri Bheesette
> *Cc:* FLUKA discussion
> *Subject:* Re: [fluka-discuss]: Plotting spectra using USRCOLL
>
> Dear Srinidhi,
>
> you should have 5 *fort* files, all of which are in binary format. They
> cannot be interpreted. You need to merge them and convert them to ASCII
> format which is readable. It can be easily done via Flair.
>
> In Flair, under "Run > Data", click on "Scan" which should automatically
> select the scoring. Then, click on "Process". Two new files (*_sum.lis and
> *_tab.lis) should be created, both of which are readable. While *_sum.lis
> contains average/cumulative quantities, *_tab.lis contains 'plot-able'
> quantities.
>
> To plot, add a USR-1D plot in Flair, and choose the *_tab.lis file.
>
> Cheers,
> Nikhil
>
> On Wed, May 3, 2017 at 2:11 AM, Srinidhi Bheesette <
> srinidhi.bheesette_at_cern.ch> wrote:
>
>> Hi all,
>>
>> I would like to plot the energy spectrum of alphas and tritium deposited
>> on a silicon sensor layer after reacting with 6LiF.
>>
>> I am using the USRCOLL scoring card to do this:
>>
>> [image: Inline images 2]
>>
>> The simulations parameters being: 1000000 primaries/cycle and 5 cycles
>> One of the fort files is attached.
>>
>> How do I interpret these files and plot the spectra using them?
>>
>> Any help would be appreciated
>>
>> Cheers,
>>
>> Shri
>>
>> (Srinidhi Bheesette)
>>
>
>
__________________________________________________________________________
You can manage unsubscription from this mailing list at https://www.fluka.org/fluka.php?id=acc_info
(image/png attachment: image.png)

(image/png attachment: 02-image.png)
(image/png attachment: 03-image.png)

(image/png attachment: 04-image.png)
- application/octet-stream attachment: medipix3rx_test_31_sum.lis
- application/octet-stream attachment: medipix3rx_test_31_tab.lis