Date: Tue, 1 May 2018 15:20:33 +0000
Dear Fluka experts,
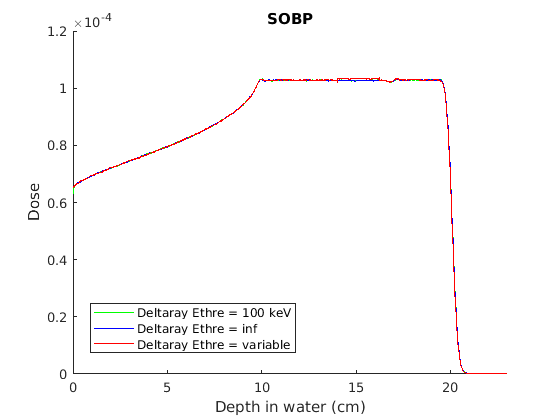
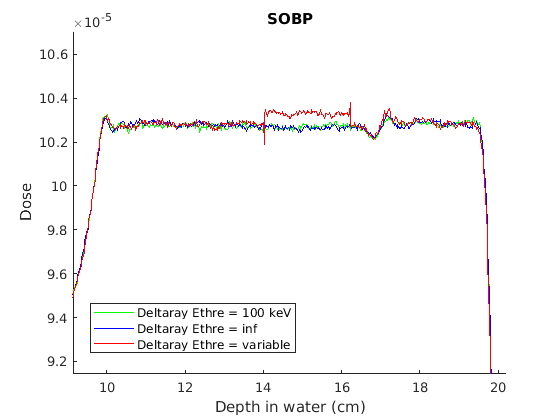
I'm simulating a SOBP in water with different deltaray thresholds as it can been seen in figure 1 below. The most energetic secondary electrons have a short range of <1 mm and therefore all energy transferred to electrons can be regarded as absorbed locally, thus, there is no difference between a depth dose-curve when using the default 100 keV deltaray threshold (green curve) or using an infinite threshold (blue curve). The curve in red results of a simulation with different transport parameters where in the middle of the SOBP (in the region between 14-16 cm) there is a "more accurate" transport. Figure 2 shows the middle of the SOBP in more detail. In this region, particles are transported with smaller step sizes and electrons are transported down to 1 keV. These parameters were optimised in previous simulations to obtain a particle transport accuracy better than 0.15%, important to model the response of ionization chambers.
Looking at the results in figure 2, it seems that there is an artefact in the energy balance. Why is the dose higher in the middle of the SOBP for the simulation with a more accurate energy transport? How can I correct for this artefact?
Attached the input files and the source file.
Many thanks,
Ana
[cid:7bd9a3f5-0799-466f-ba0b-e2ae5673865a]
Fig 1
-----------------------------------------------------------------------------------------------
[cid:458eee87-1def-4657-9cc0-ac67f35616af]
Fig 2
__________________________________________________________________________
You can manage unsubscription from this mailing list at https://www.fluka.org/fluka.php?id=acc_info
(image/png attachment: untitled.png)
(image/png attachment: untitled2.png)
- application/octet-stream attachment: source_v1.f
- application/octet-stream attachment: SOBPfano.inp
- application/octet-stream attachment: SOBPinf.inp
- application/octet-stream attachment: SOBP100.inp