Date: Thu, 16 Aug 2018 11:38:54 +0800 (GMT+08:00)
Dear FLUKA experts:
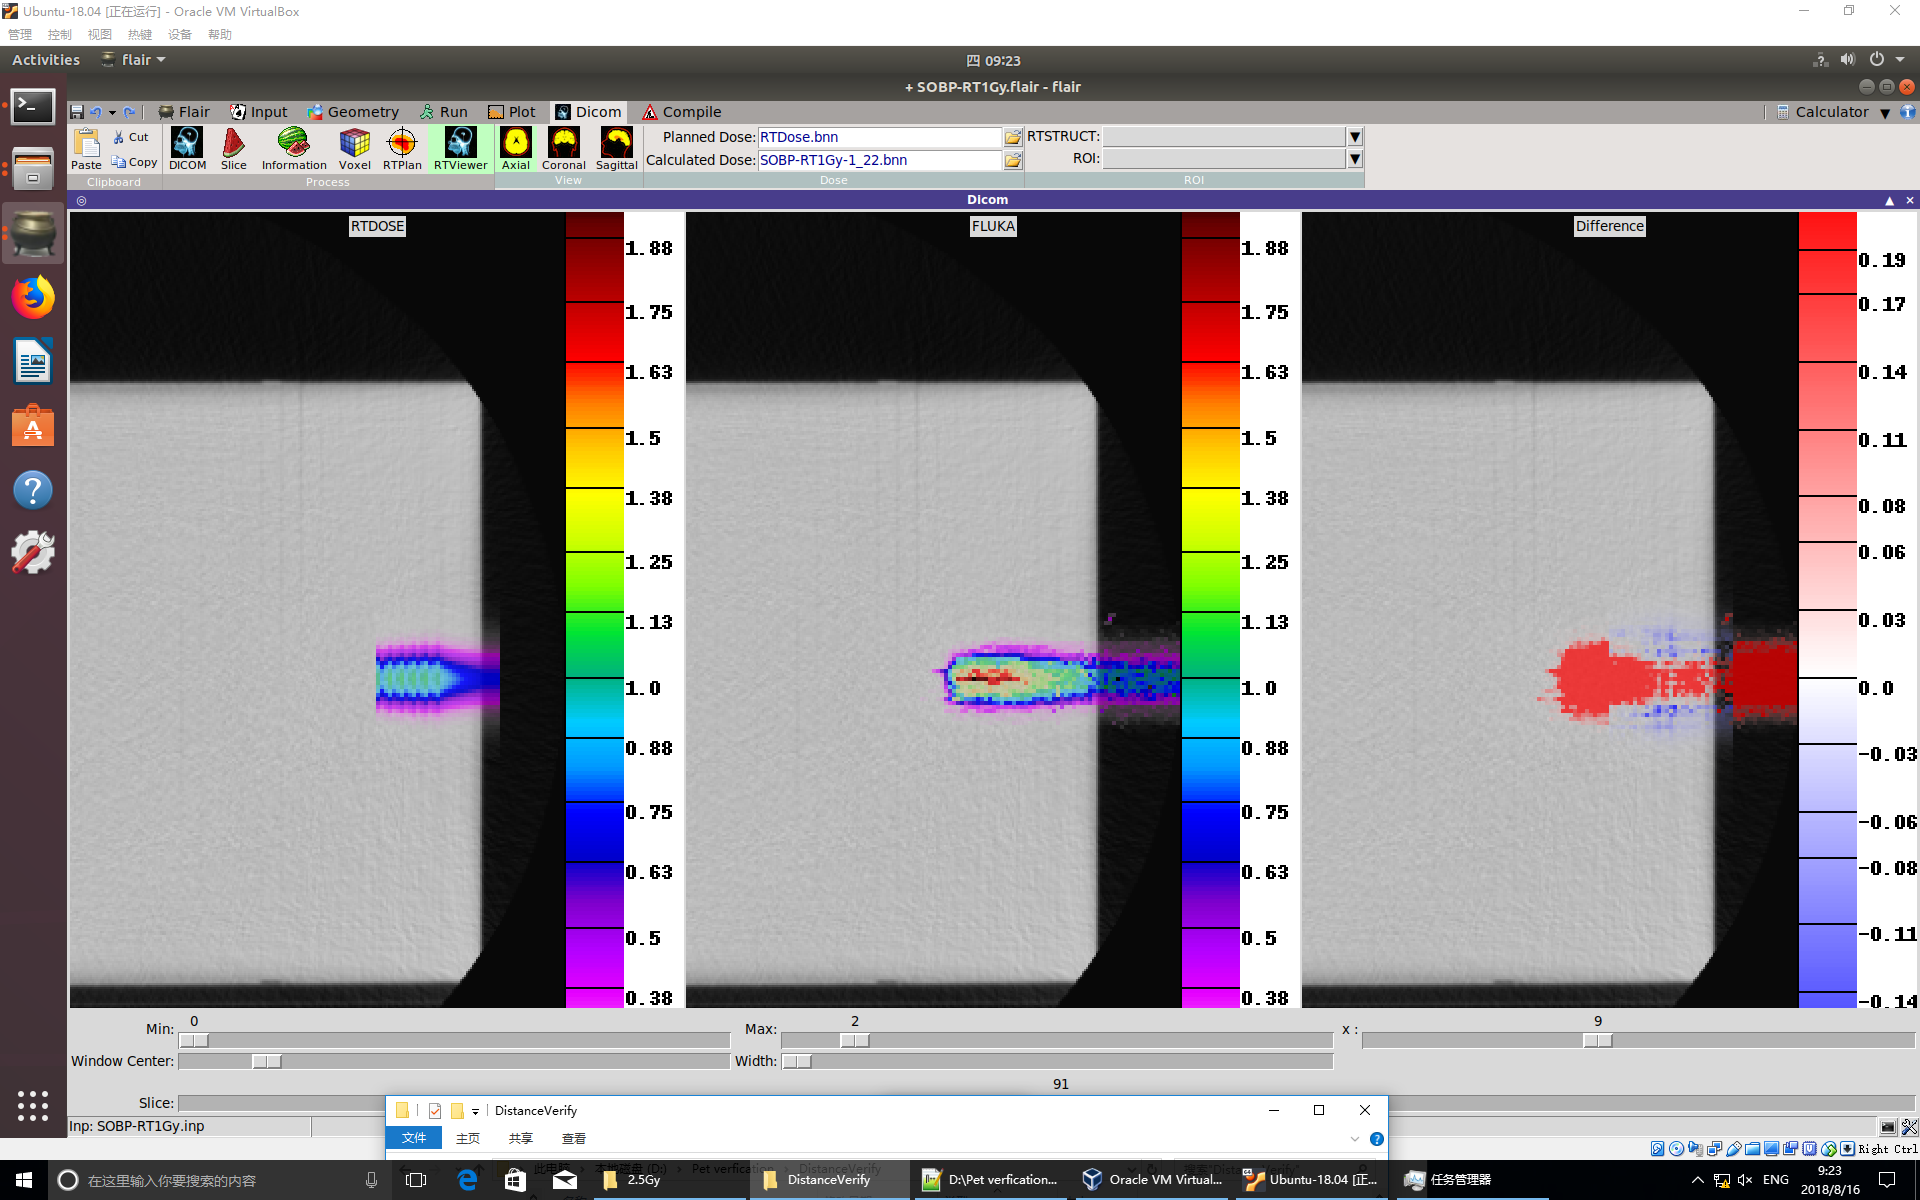
I try to simulate dose distribution from a plan generated by TPS. If I compare the RTDose and FLUKA dose in Dicom RTViewer in flair, the dose value seems OK (DoseInRTViewer.png).
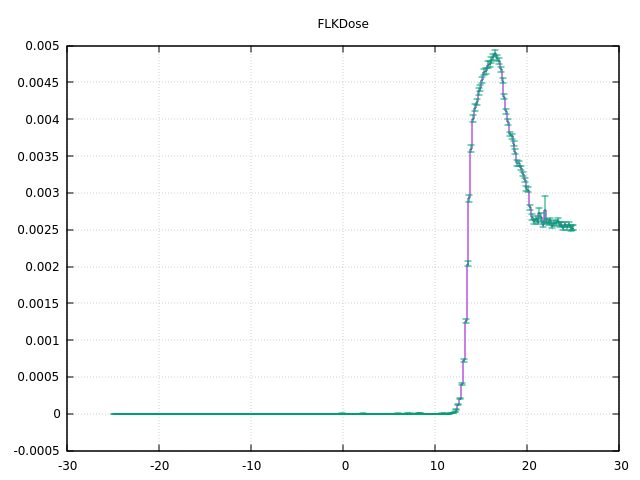
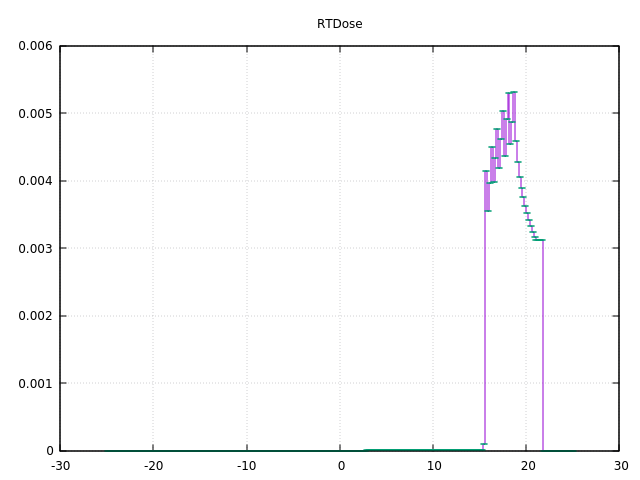
But if I try to plot the bnn file in plot of flair, then the dose value seems reduced in the 1-D plots (*-1D.png).
How should I understand the dose value in 1D plot, is it still with a default unit?
I have already tune the USRBIN dose weight with a 1.602E+7 and total particle number recorded in treatment plan in Comscw.f subroutine.
Thanks in advance.
Best,
Junyu
__________________________________________________________________________
You can manage unsubscription from this mailing list at https://www.fluka.org/fluka.php?id=acc_info
(image/png attachment: FLKDose-1D.png)
(image/png attachment: RTDose-1D.png)
(image/png attachment: DoseInRTViewer.png)