Date: Sun, 22 Mar 2020 11:44:50 +0000
Dear Mario
I am very sorry to disturb you again regarding this matter yet the one last thing remains unclear for me:
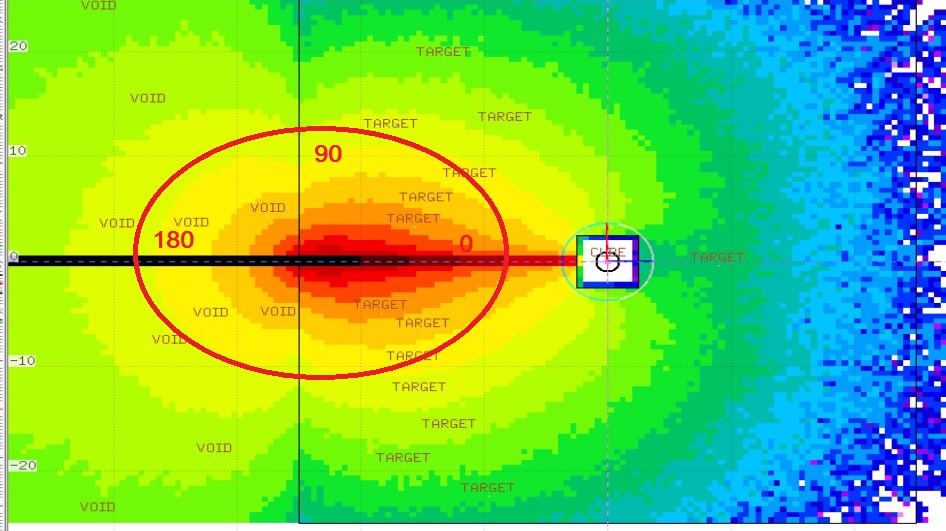
1. why I get usryield 0 results when I choose VOID > TARGET? But I get meaningful results when I choose TARGET>VOID. I saw the note 2) from the manual but I expected that if we switch the regions we in general get the same results only 0-180 angles will be vice versa.
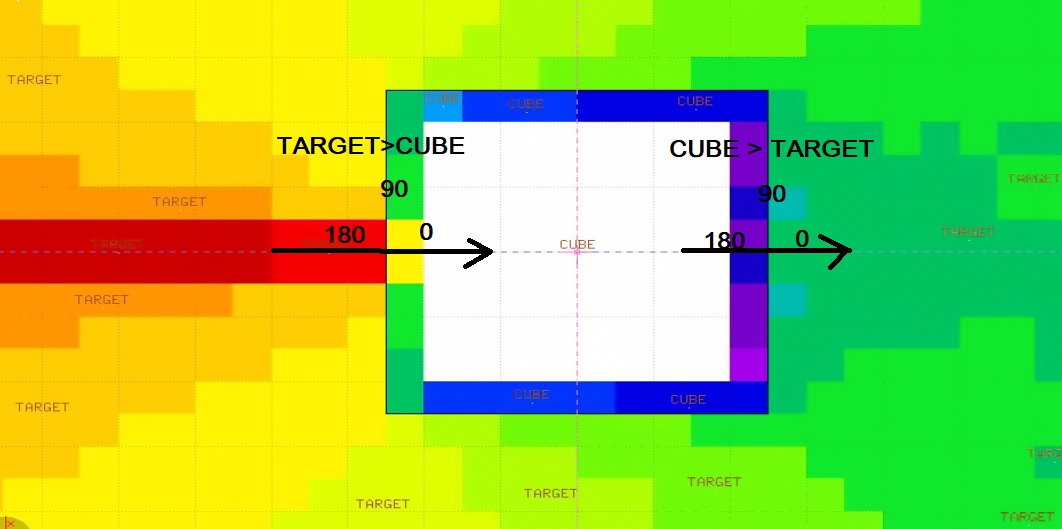
1. To sum up, it is stated it scores "yield across a boundary surface" but I cant understand the difference between the region selection; could you look the 2nd picture (usrbin photon fluence), do I understand correctly the difference between TARGET > CUBE and CUBE > TARGET ?
Thank you very much
Rgds
A,
From: Santana, Mario <msantana_at_slac.stanford.edu>
Sent: Thursday, March 19, 2020 22:36
To: Ševčik Aleksandras <aleksandras.sevcik_at_ktu.edu>
Cc: fluka-discuss <fluka-discuss_at_fluka.org>
Subject: Re: [fluka-discuss]: use of usryield for energy/angle plot
Hi,
>I need Y-axis to show the kinetic Energy of the scattered photons; However, the quantity I am getting >is not this most likely because of wrongly chosen WHAT(12) - what it gives me?. Which WHAT(12) >option should I use to see kinetic energy of the scattered photons?
Unfortunately, you will not be able to get a plot of energy vs. angle like you suggested in your first email. USRYIELD is generating double differential data dN/dX1dX2, sliced for a specific dX2 bin. This can be purely dN/dX1dX2, or related to cross-section, etc. as per settings of What(12).
You might be wondering how else can you achieve such plot, and I would then guide you towards the use of USERDUMP + mgdraw.f subroutine. You would then be able to obtain a scatter plot Energy vs. angle, and you would then realize that your fundamental assumption is wrong, i.e. for a given angle there is not a fix energy, but an energy distribution. You could of course for example plot <E> vs angle , or remain with the cloud plot.
>X-axis shows us the angle rage 2.5-3.1415 rad divided by 100 bins ?
No, in your case you set X axis to be the energy of photons up to 0.001 GeV, linearly in 100 bins
>TARGET > TARGET1 means the boundary where the scattered photons are crossing?
YES.
-M
________________________________
From: Ševčik Aleksandras <aleksandras.sevcik_at_ktu.edu<mailto:aleksandras.sevcik_at_ktu.edu>>
Sent: Thursday, March 19, 2020 3:25 AM
To: Santana, Mario <msantana_at_slac.stanford.edu<mailto:msantana_at_slac.stanford.edu>>
Cc: fluka-discuss <fluka-discuss_at_fluka.org<mailto:fluka-discuss_at_fluka.org>>
Subject: RE: [fluka-discuss]: use of usryield for energy/angle plot
Dear Mario
Thank you for point out the mistake. Could you please help in explaining the interpretation of the graph I have attached which I got with the following USRYIELD in layman terms:
*...+....1....+....2....+....3....+....4....+....5....+....6....+....7....+....
USRYIELD 1401. PHOTON -26. TARGET TARGET1 yield4
USRYIELD 0.001 0.0 100. 2. 1.5 3. &
As far as I understand:
* I need Y-axis to show the kinetic Energy of the scattered photons; However, the quantity I am getting is not this most likely because of wrongly chosen WHAT(12) - what it gives me?. Which WHAT(12) option should I use to see kinetic energy of the scattered photons?
* X-axis shows us the angle rage 2.5-3.1415 rad divided by 100 bins ?
* TARGET > TARGET1 means the boundary where the scattered photons are crossing?
Thank you very much for elaborative explanation. Course slides I have could not help me much, unfortunately.
Rgds
Alex
From: Santana, Mario <msantana_at_slac.stanford.edu<mailto:msantana_at_slac.stanford.edu>>
Sent: Thursday, March 19, 2020 02:46
To: Ševčik Aleksandras <aleksandras.sevcik_at_ktu.edu<mailto:aleksandras.sevcik_at_ktu.edu>>
Cc: fluka-discuss <fluka-discuss_at_fluka.org<mailto:fluka-discuss_at_fluka.org>>
Subject: Re: [fluka-discuss]: use of usryield for energy/angle plot
Hi Aleksandras,
In flair empty plots usually are not plotted and you get a plot error message instead. This is what is happening in this case.
The reason is that you are requesting USRYIELD at the interphase between TARGET1 and _at_LASTREG, but _at_LASTREG=TARGET1, thus nothing can be scored.
(Also note that in your input file you have comments referring to cylindrical targets but instead you are using cubes)
-M
On Mar 17, 2020, at 9:22 AM, Ševčik Aleksandras <aleksandras.sevcik_at_ktu.edu<mailto:aleksandras.sevcik_at_ktu.edu>> wrote:
Dear Fluka experts,
I am trying to utilize USRYIELD to be able to create the scattered photon plot , energy vs angle as per attached example.
I created the several usryield detectors as I understood from the tutorial courses as well as from some examples, see the attached inp file.
However, I am unable to plot any of them - when trying to do so, getting plot errors and nothing more.
Could someone point out my mistake and how I could gather the required data to plot energy vs angle in this case - I would appreciate so much a detail explanation,
Alex
<example.png><scatter.inp>
__________________________________________________________________________
You can manage unsubscription from this mailing list at https://www.fluka.org/fluka.php?id=acc_info
(image/jpeg attachment: photon_fluence_1st.jpg)
(image/jpeg attachment: photon_fluence_2nd.jpg)