Date: Mon, 23 Nov 2020 16:32:24 +0000
Dear Fluka experts,
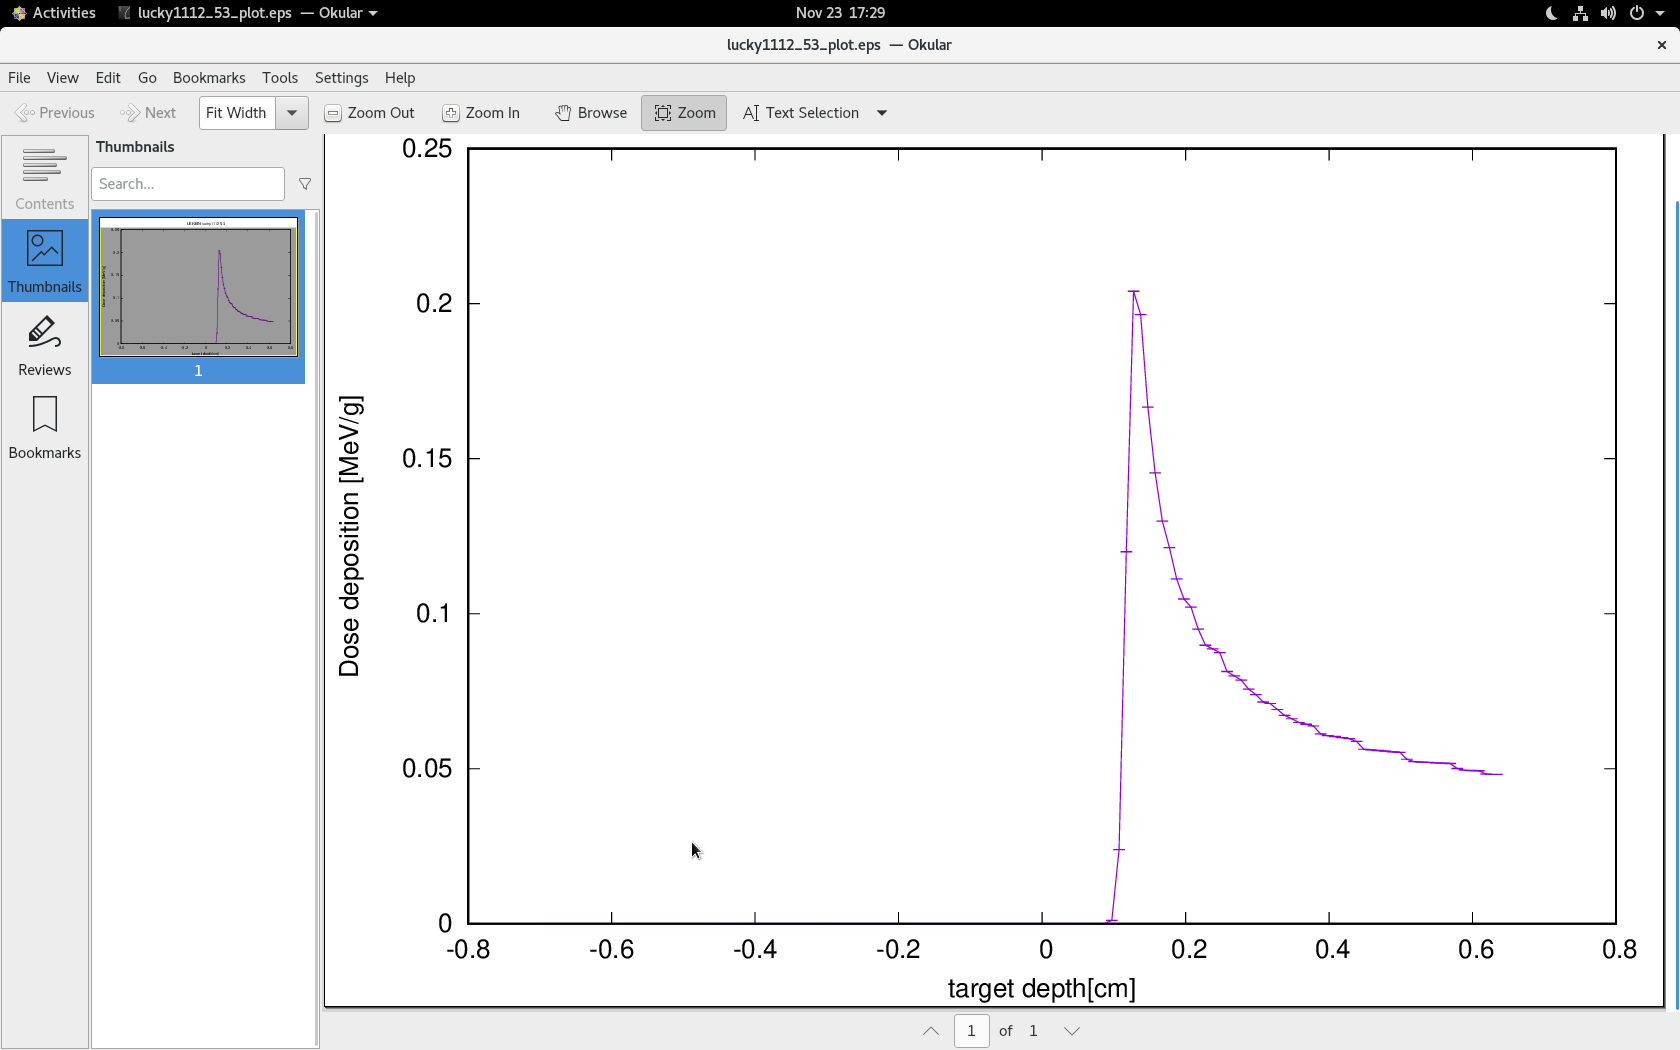
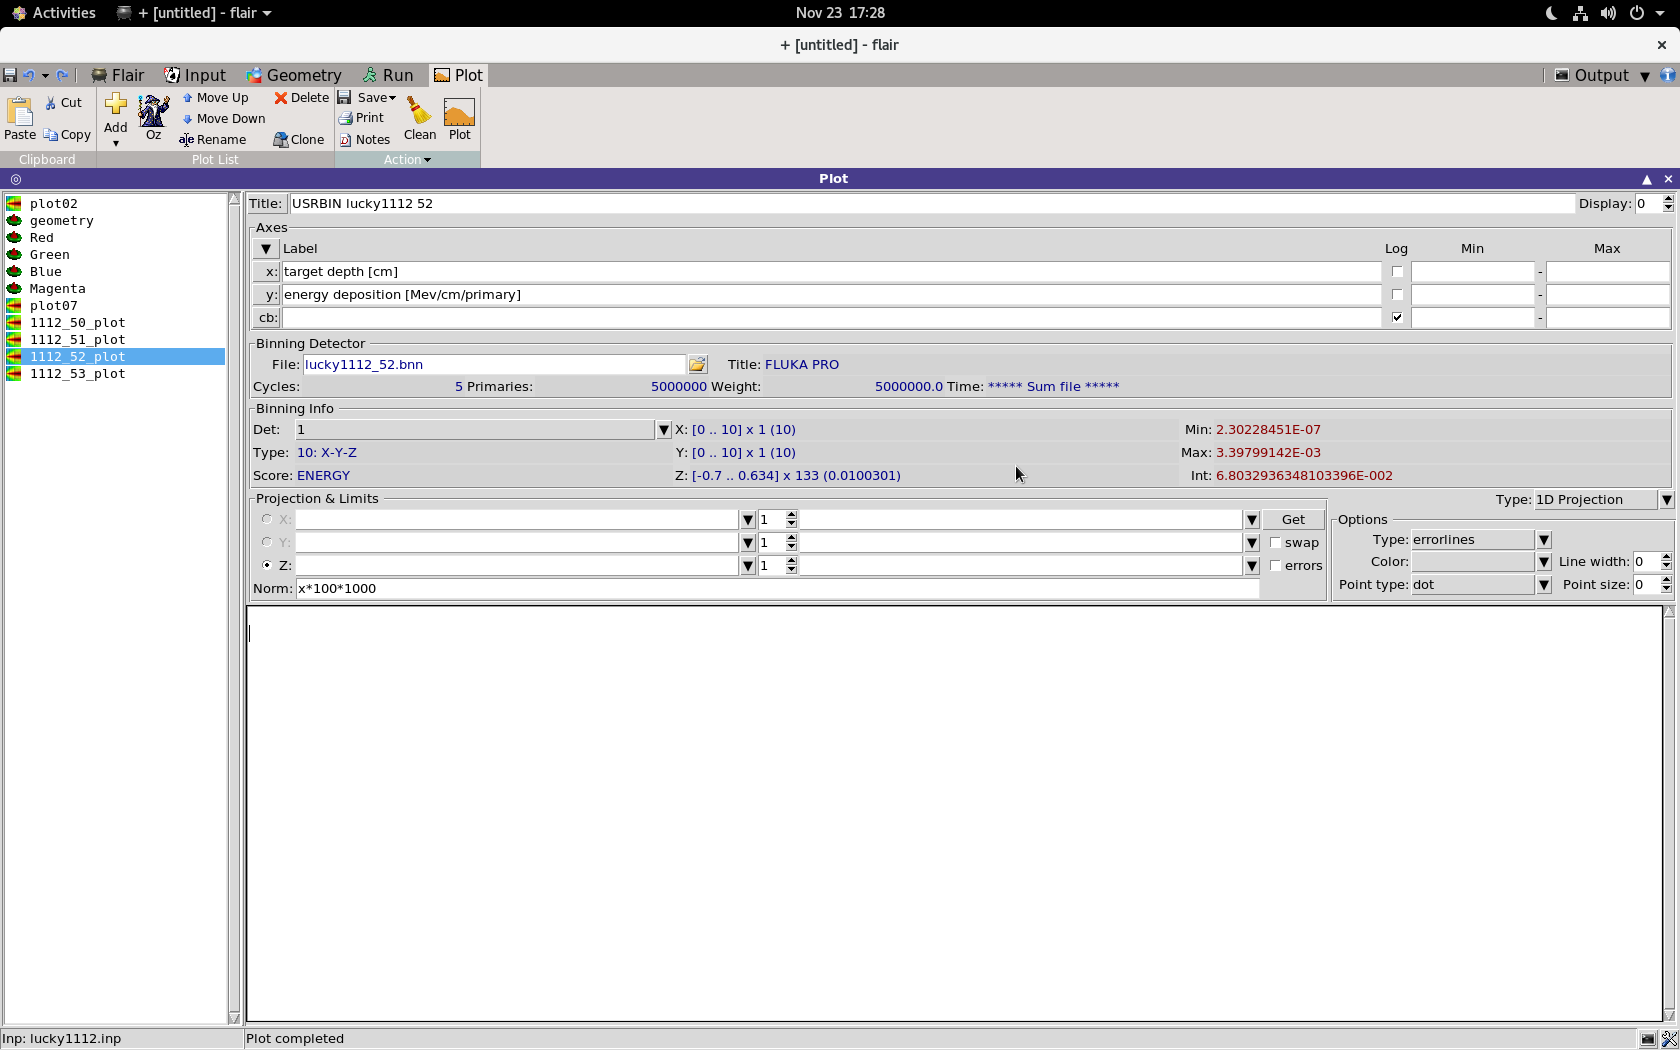
I could draw the Bragg peak with 1D projections from the USRBIN plot in flair (as shown in below figure),
but I want to superimpose multiple Bragg peak curves on the same figure.
I know how to superimpose data with “USR-1D” plot frame in flair.
Does USRBIN plot in flair have a similar function as “USR-1D” plot or are there other ways to superimpose datas ?
Any suggestions or comments will be appreciated.
Best regards,
Qi Ding
[cid:863ce60c-50a9-4684-9831-e7363105199c]
[cid:43e9cbb4-6556-4546-ae91-76504dc78ee9]
------------------------------------------------------------------------------------------------
------------------------------------------------------------------------------------------------
Forschungszentrum Juelich GmbH
52425 Juelich
Sitz der Gesellschaft: Juelich
Eingetragen im Handelsregister des Amtsgerichts Dueren Nr. HR B 3498
Vorsitzender des Aufsichtsrats: MinDir Volker Rieke
Geschaeftsfuehrung: Prof. Dr.-Ing. Wolfgang Marquardt (Vorsitzender),
Karsten Beneke (stellv. Vorsitzender), Prof. Dr.-Ing. Harald Bolt
------------------------------------------------------------------------------------------------
------------------------------------------------------------------------------------------------
__________________________________________________________________________
You can manage unsubscription from this mailing list at https://www.fluka.org/fluka.php?id=acc_info
(image/png attachment: energy_bragg_.png)
(image/png attachment: 1123flair.png)