Date: Thu, 26 Feb 2009 22:41:25 +0100 (CET)
Hi Roy,
ok, it looks fine now!
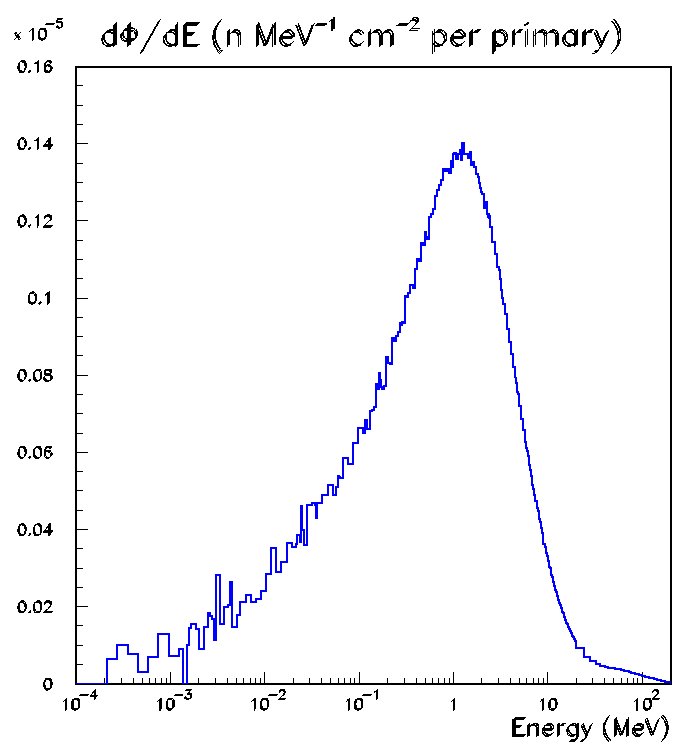
I send you the differential fluence distribution, that I found
running with your input file (with minor changes), because you
can see there all the low-energy part of the spectrum...
it seems to me, in fact, that you cut above the secondary neutron peak,
that is around 1 MeV... but maybe this is exactly what you want to do!
cheers,
Anna
> Thank you Anna and Alberto,
>
> It looks like my problem was that I was multiplying the values that
> Fluka gave me by the bin width (as described in the USRTRACK section of
> the manual...). I was in fact reading the low energy values in the
> correct order already.
>
> At the high/low boundary, the values, when multiplied by their bin
> energy widths are:
>
> Low energy: 1.1050E-04 * 3.596700E-04 = 3.9743535e-08
>
> High energy: 9.3207E-05 * 4.0000E-03 = 3.728280e-07
>
> which gave me the order of magnitude mismatch.
>
> I've attached a semilog plot, which has the data plotted as Alberto
> suggested, and it looks much better. Now I can address my other issues :)
>
> Thanks again,
> Roy
>
>
> Anna Ferrari wrote:
>> Hello Roy,
>>
>>> I suspect I am making an obvious mistake somewhere.
>>
>> you are right. There is not a discontinuity in your high energy-low
>> energy neutron spectra, simply you did not correctly read
>> the output file: you have read the low-energy part in the inverse mode.
>>
>> The results of the high energy part are written starting with the lower
>> energy bin (20 MeV, 24 MeV); the binning of the low energy part of
>> the spectrum starts with the GROUP 1, that corresponds to the
>> higher energy interval (19.6 MeV, 20 MeV).
>> Your contents are: 1.105 10^-4 in the bin (19.6,20)
>> 9.32 10^-5 in the bin (20,24)
>>
>> and you will find a continous behaviour.
>>
>> Just two suggestions more:
>> 1) in your .inp file you have set the USRTRACK card with: linear
>> binning in (0, 0.2) GeV, 50 bins. For neutrons FLUKA will force
>> the binning to fit with the 260 neutron groups (logaritmically
>> binned) between the thermal region and 20 MeV; above 20 MeV
>> you get 45 linear energy bins. If you want to better control
>> your linear binning in the high energy part, you can use
>> the USRTRACK in two steps, for the two energy ranges.
>>
>> 2) you can also use a non-formatted output (using a negative number in
>> what(3)) and then run the post-processing program ustsuw (see the
>> manual
>> for the details): in this way you will get - between other outputs -
>> a file [output]_tab.lis, which shows in the first two columns the
>> energy
>> boundaries, in the third the corresponding bin content and in the
>> last
>> one the statistical error.
>>
>> cheers,
>>
>> Anna
>>
>>
>>> Hello Fluka users,
>>>
>>> I am trying to measure the neutron fluence energy spectrum of
>>> annihilation neutrons produced by antiprotons incident on a copper
>>> target. I am using USRTRACK to score the neutrons, but when I
>>> calculate
>>> and plot the "low" and "high" energy parts of the spectrum together,
>>> there is a large mismatch in the spectrum at 20 MeV (see attached
>>> plot).
>>>
>>> I am using the 260 group low energy neutron transport library and am
>>> scoring up to 0.2 GeV. To obtain the fluence energy spectrum, I am
>>> multiplying each bin by its energy width in GeV.
>>>
>>> I am not sure if my 0.0564 cm thick target qualifies as "very thin" and
>>> would lead to the artifacts mentioned in section 10.1.1 of the Fluka
>>> manual.
>>>
>>> If anyone has any idea why I am seeing such a disjointed spectrum, I
>>> would greatly appreciate hearing back. I suspect I am making an
>>> obvious
>>> mistake somewhere.
>>>
>>> Thanks,
>>> Roy
>>>
>>
>