Date: Fri, 14 Aug 2009 23:53:44 +0200
OK.
I run your input file (it somehow only works when executed from within
FLAIR) and then saw that the resulting usrbin file is very large. For
instance, when merging files usbsuw goes out of an array index
"Subscript out of range on file line 231, procedure usbsuw.f/MAIN.
Attempt to access the 12000001-th element of variable gmstor.
... line 46: 15751 Aborted"
Actually I see that you have chopped your mesh in sections and that you
have attached the plots of the different parts next to each other.
However the data files were corrupt, as you noticed.
The easiest fix is simply to use different usrbin for each section, and
NOT put all your 100x100x100 meshes into the same usrbin (97). You may
still be able to group several bins into a single usrbin, but certainly
not all of them.
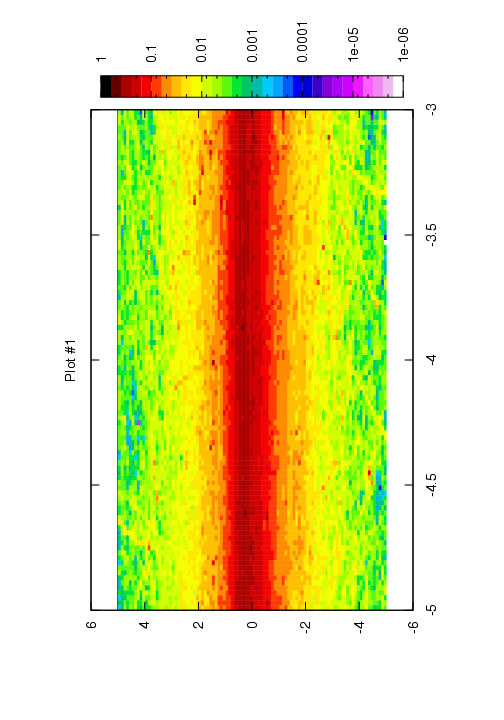
I tried with all bins separated into different usrbins (80, 81,...,96).
I attach a resulting plot from one of the bins (not normalized). As you
can see now the maximum is along the beam axis, as expected.
-----Original Message-----
From: J.Stiller_at_stud.uni-heidelberg.de [mailto:J.Stiller_at_stud.uni-heidelberg.de]
Sent: Fri 8/14/2009 6:51 PM
To: Mario Santana Leitner
Cc: fluka-discuss_at_fluka.org
Subject: RE: Plotting Usrbin card
Hi Mario,
thank you for your quick reply. Sorry that I did not attach the .inp
file, I probably had hoped that it was not necessary, however, I
attached it now.
I did look the USRBIN output and could not find any negative numbers.
I am using rectangular coordinates. In order to get a "high resolution"
picture I sliced up the whole geometry into 2 cm-usrbin
pieces and than merged them all together with gnuplot. However, all
the single plots already show this strange behavior so it should not
be the gnuplot skript. Note that I did not run with many primaries (5x10)
to save cpu time (since there are a lot of usrbin cards).
However when I did run with many primaries and only one usrbin card
the picture looks about the same (the assigment of the colors is the
same).
Thanks for help and advice,
Johannes
Quoting Mario Santana Leitner <Mario.Santana_at_cern.ch>:
> Hi,
>
> There is not enough information to determine the ultimate cause of
> the problem (is it in the FLUKA part, or in FLAIR?...).
> We would need to have the input file and the FLAIR file.
> However, there is one thing that you can already try. Did you look
> at the usrbin file data? (convert it to ascii and browse through the
> data). Is there any negative value? In the past when the combined
> number of particles from different values exceeded a certain
> threshold, the resulting usrbin got a little crazy and included some
> negative values which lead to plots like the one you are showing. I
> assume that this is not your case now since your 1d histogram is
> looking fine, but check it anyway. Also try/check the following:
> - Is your usrbin in rectangular or cylindrical coordinates?
> - In case your plot is in rectangular coordinates, are you plotting
> your entire usrbin matrix or just a slice between two planes to the
> left and right of the central (Z) axis?
>
> Mario
>
>
> -----Original Message-----
> From: owner-fluka-discuss_at_mi.infn.it on behalf of
> J.Stiller_at_stud.uni-heidelberg.de
> Sent: Thu 8/13/2009 11:23 PM
> To: fluka-discuss_at_fluka.org
> Subject: Plotting Usrbin card
>
> Dear Fluka experts,
> looking at the plot I attached the energy deposition is the lowest in
> the middle of the shower and peaks at the edge of my geometry. That
> does not make sense to me since the 1-D histograms tell me the biggest
> energy deposition is in the middle of the geometry (which makes
> sense). I am using flair to do this plots, and I am wondering if the
> colors might be assigned in the wrong order...If not, what is my fault?
>
> Thanks for all the help, Johannes
>
>