Date: Tue, 7 Dec 2010 15:03:59 +0000
Hi Manuel,
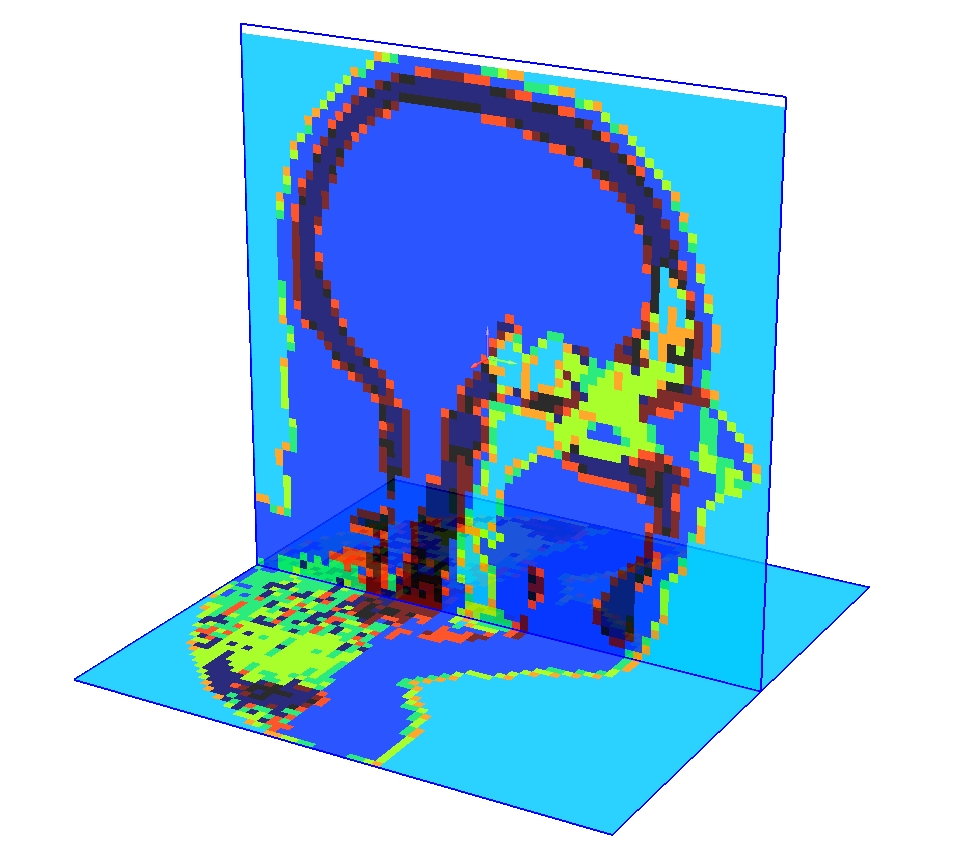
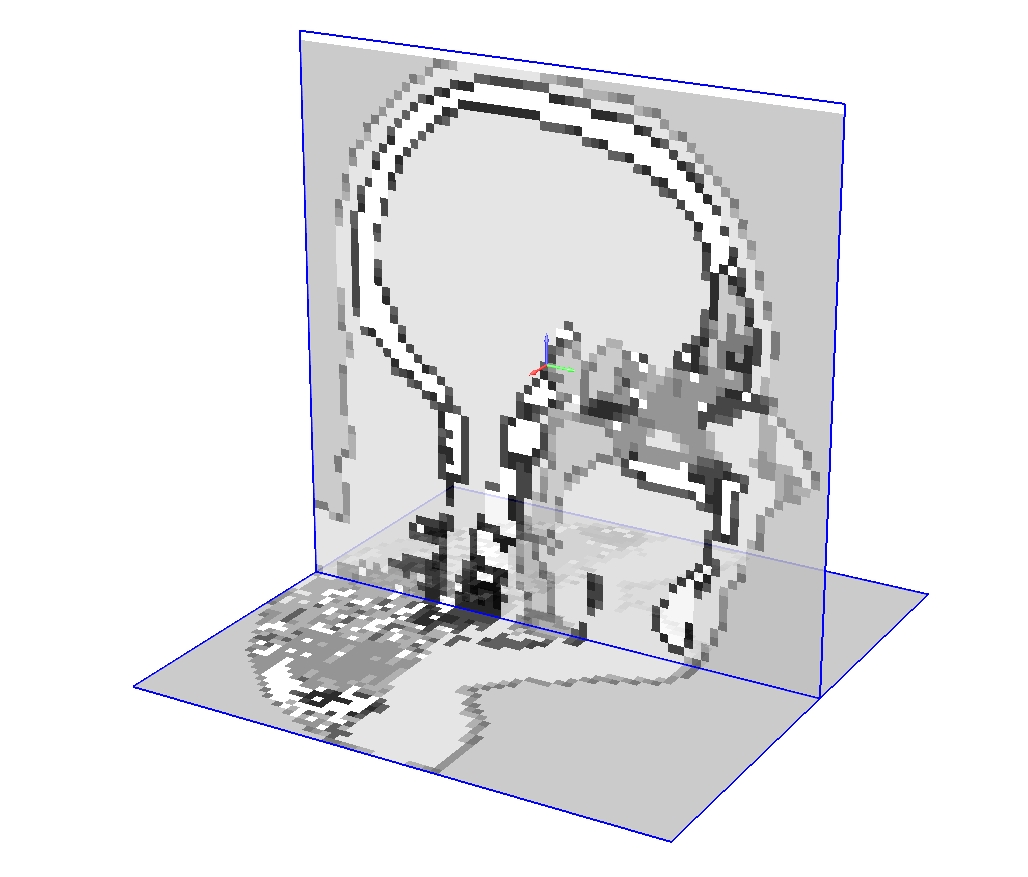
in principle you could try to visualize your voxels with the DaVis3D
plugin of SimpleGeo (www.cern.ch/theis/simplegeo). It can read a very
simple XYZ-voxel format (see the manual) and you can interactively
create sections of your data as shown in the attachment with a voxel
phantom. In addition you can use some of the pre-defined color tables
which would for example highlight certain voxel values as shown in the
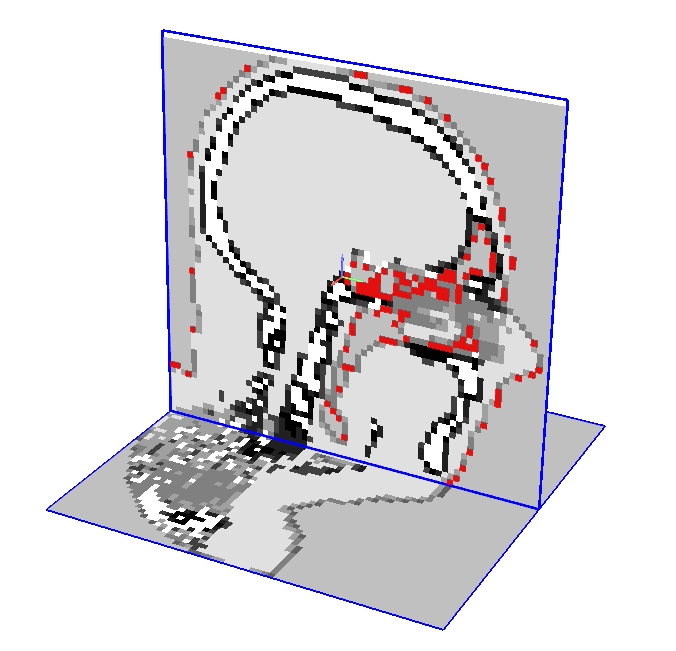
attachment. Another way to localize areas is to use the contour function
which will emphasize the contours of areas above/below a user defined threshold.
Cheers
Chris
> -----Original Message-----
> From: owner-fluka-discuss_at_mi.infn.it [mailto:owner-fluka-
> discuss_at_mi.infn.it] On Behalf Of Manuel Kunz
> Sent: 07 December 2010 11:27
> To: fluka-discuss_at_fluka.org
> Subject: Voxel-geometry in shades of grey
>
> Dear FLUKA users,
>
> I try to simulate the clinical radiation of a prostate gland. But the geometry-
> plot of my pelvis-ct includes only the colors black and white which makes it a
> little bit difficult to find the prostate gland (no just kidding, for sure it´s
> impossible).
>
> Is there an easy way to plot the voxel-geometry in shades of grey like a
> normal ct pic? Or does anybody know how I should find my PTV any other
> way?
>
> Best regards
> Manuel
>