Date: Sat, 20 Jul 2013 18:24:43 +0200
Dear Fluka users, Dear Vasilis,
I recently upgraded flair to version 1.1-3 but when I open some old simulation I have a strange behaviour:
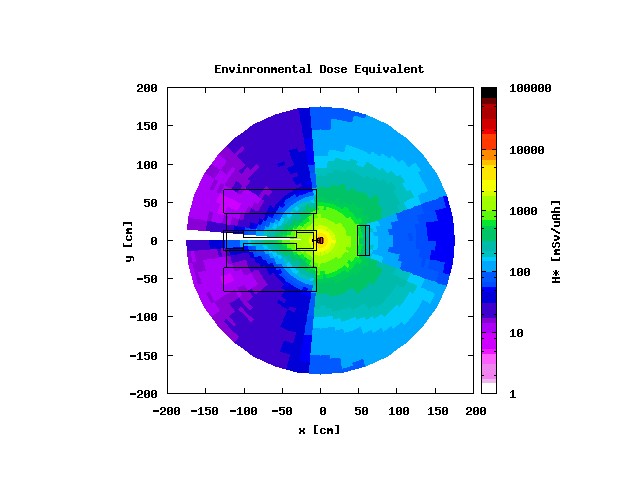
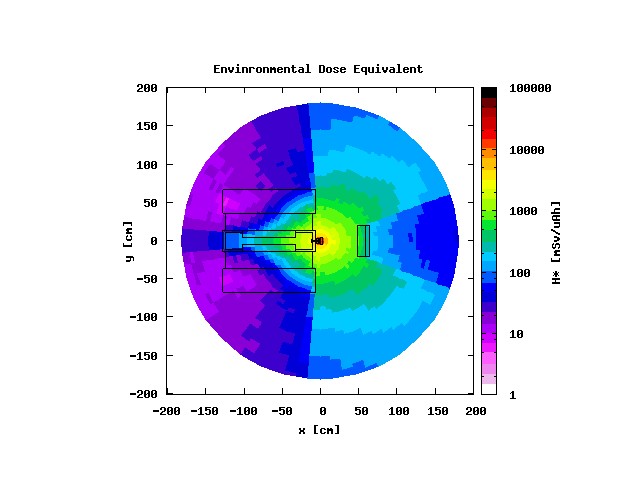
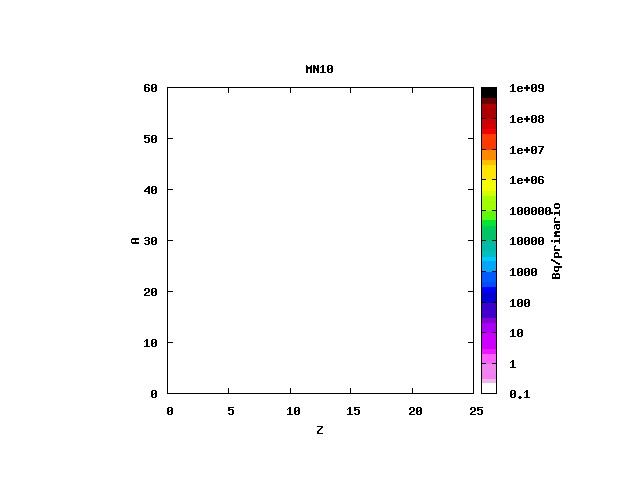
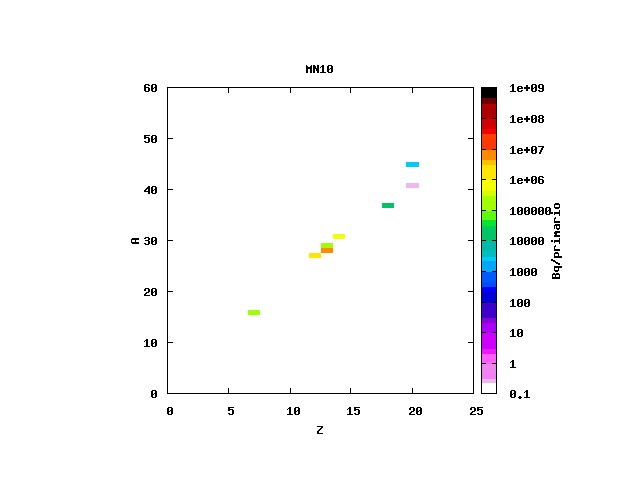
As you can see from the images attached, Resnuclei plot is blank when I know that it is not; furthermore, when I plot a polar userbin seems that a polar bin is not plotted.
I saw, from the output window, that a command "set logscale z" is called. If I unset the logscale on z, everything return as I obtained with with my previous version of flair (1.0-0).
Any other users have the same problem?
Can someone explain me the meaning of the command "logscale z"? (expecially for the resnuclei plot since the logscale is already set in the color box)
I run fluka/flair on Fedora 19 and gnuplot 4.6.1-6 is installed. Fluka version is 2011.2b.3. I notice the same problem on linux Mint 15.
Thank you
Angelo
--
Ing. Angelo Infantino, Ph.D. student
Department of Industrial Engineering - Laboratory of Montecuccolino
University of Bologna
tel +39 051.2087.702; fax +39 051.2087.747

(image/jpeg attachment: polar_userbin_set_logscalez.jpg)

(image/jpeg attachment: polar_userbin_unset_logscale.jpg)

(image/jpeg attachment: Resnuclei_set_logscalez.jpg)

(image/jpeg attachment: Resnuclei_unset_logscalez.jpg)