Date: Tue, 05 Nov 2013 11:51:14 -0800
Dear Emilio,
Thank you very much for your help. Your explanation was clear and I
understand how EVENDAT works in combination with the SCORE card.
I am writing this for the benefit of others who might come across the
same problem. 1) I was not able to write out a binary file. 2) the
results are puzzling.
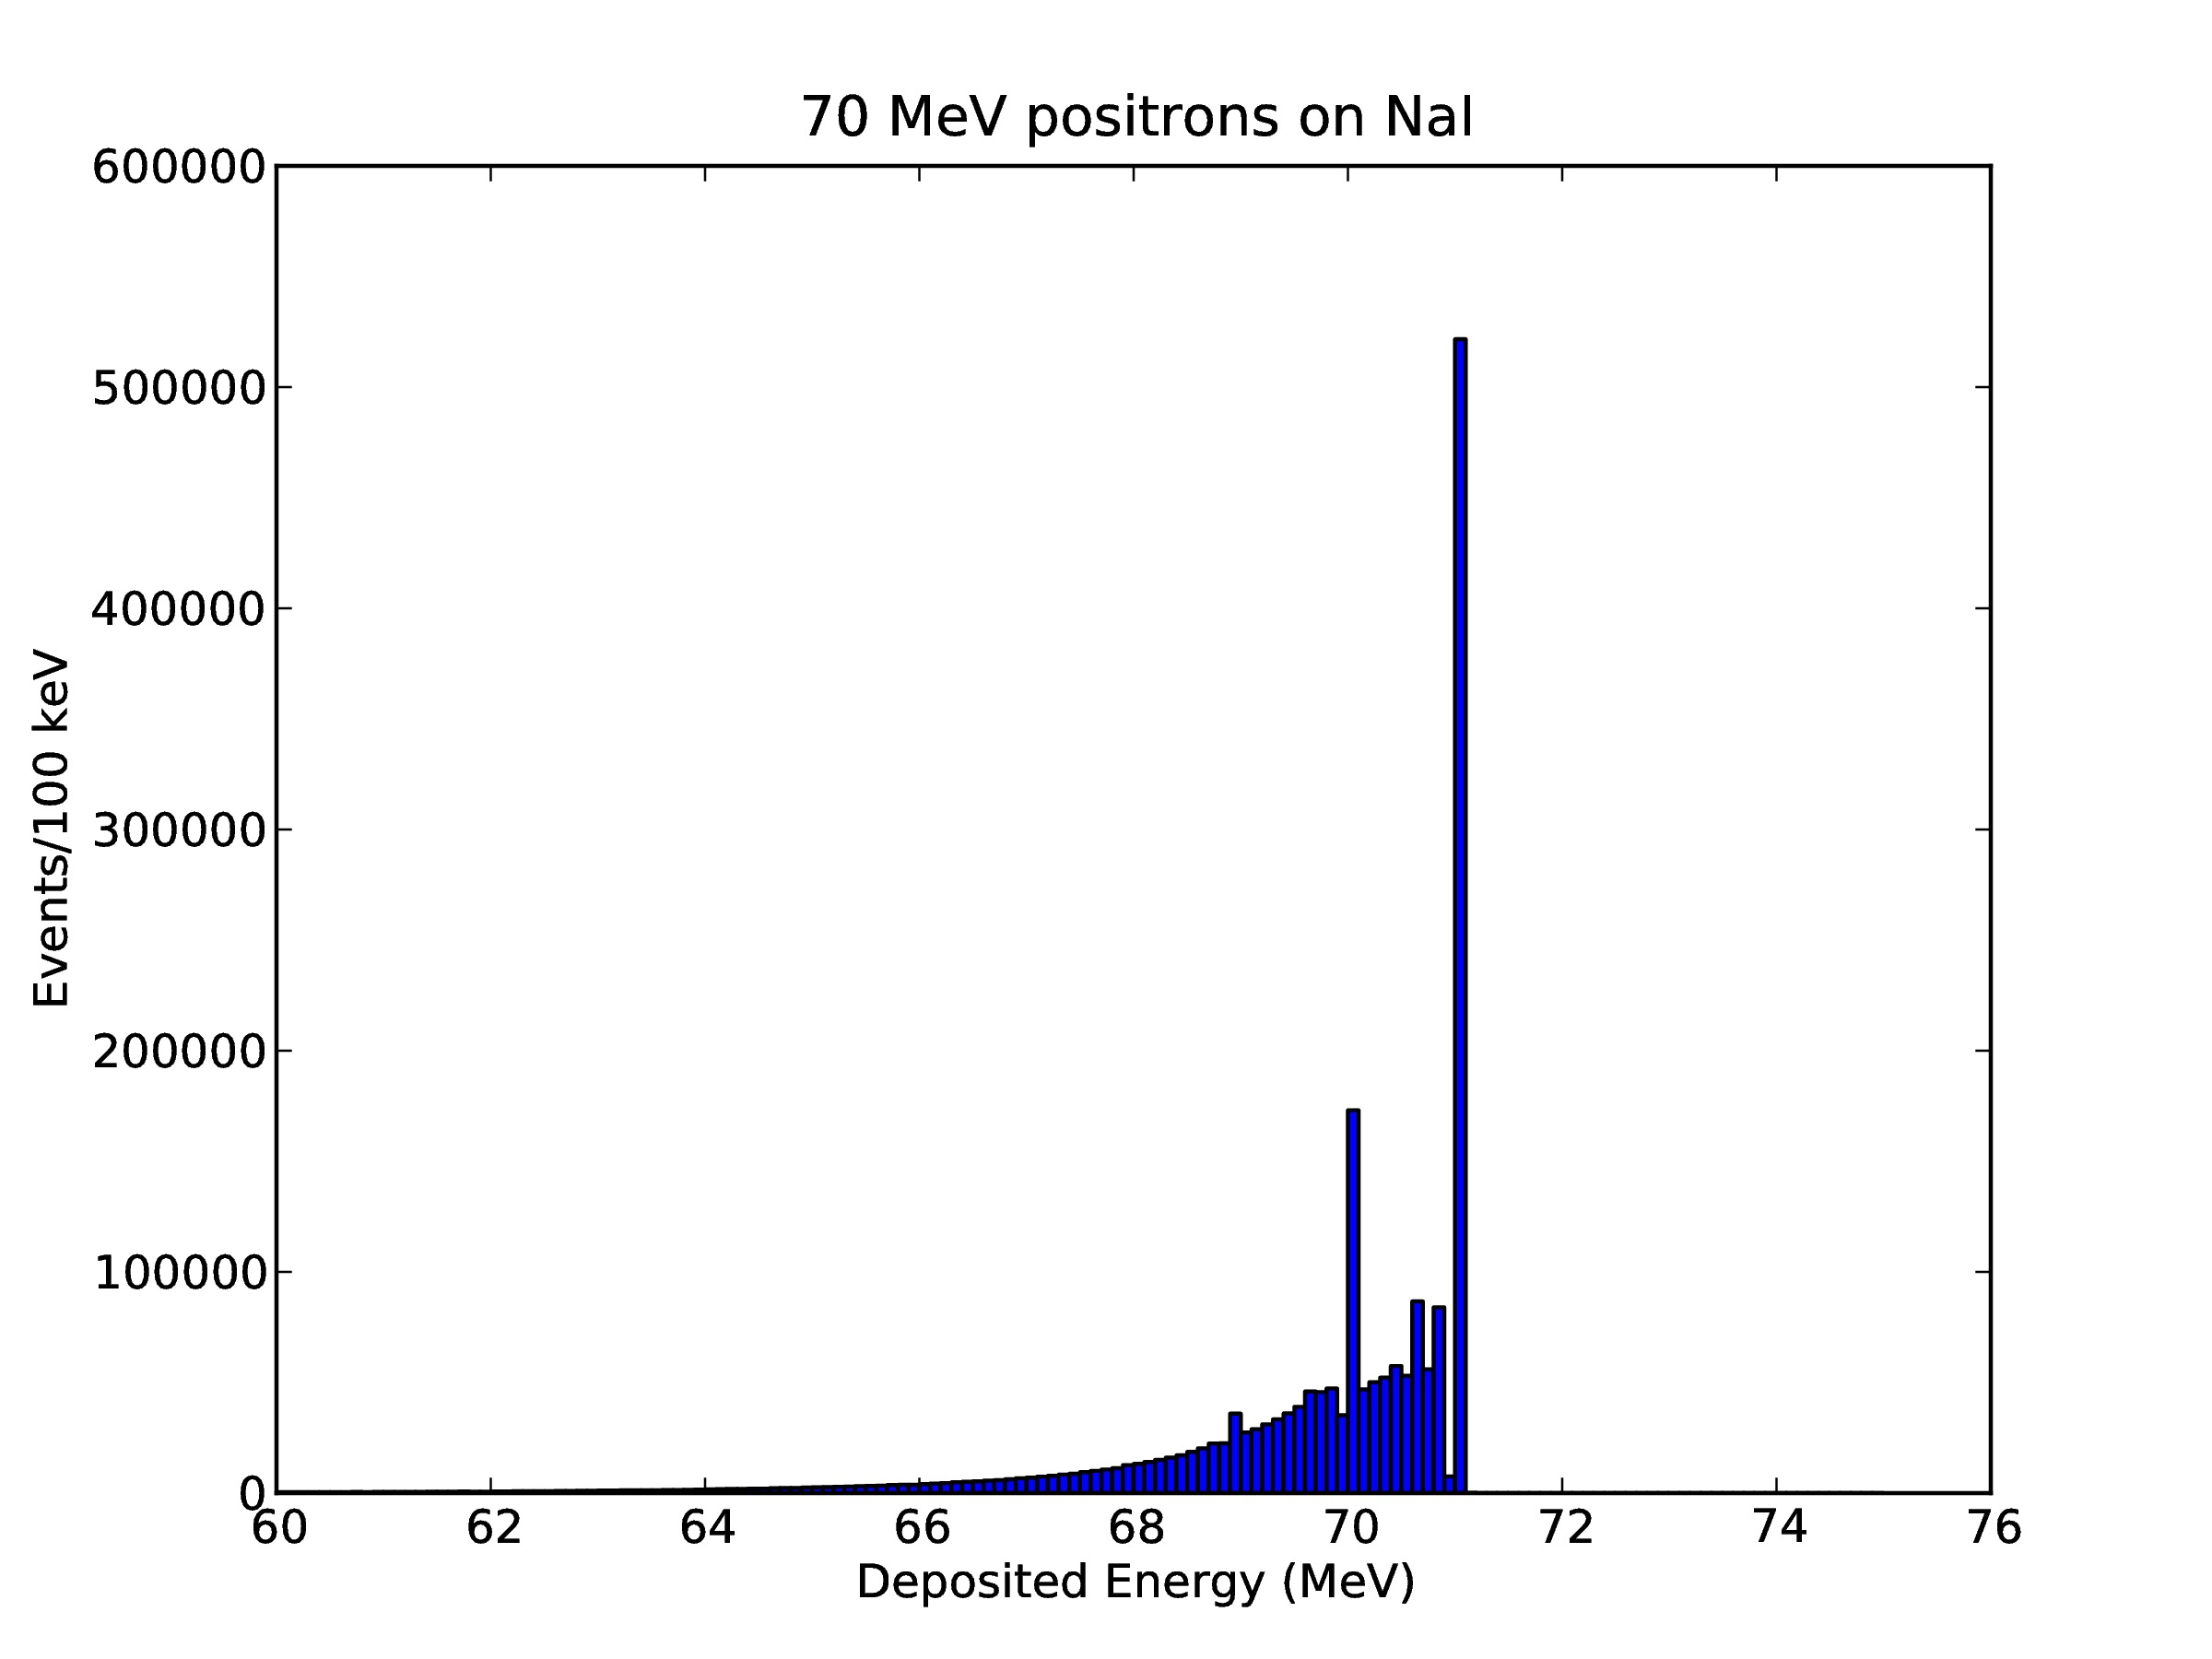
My setup is simple. I have a mono-ergetic positron beam at 70 MeV with
a flat distribution (1mm x 1mm), incident on an NaI target (r = 24 cm, l
= 48 cm). Beam is centered on the target. The NaI is surrounded by
vacuum and the vacuum is surrounded by BLACKHOLE.
Using EVENTDAT card, I was able to write out deposited energy on an
event by event basis; however, I did not see an option for writing out a
binary file (at least not through flair). I was only able to produce an
ASCII file. How does one select a binary file format for output?
The manual says:
*WHAT(1) = output unit
If < 0, the output is unformatted. Values of |WHAT(1)| < 21
should be avoided (with the exception of +11).
Default = 11 (standard output)*
In the drop-down list of Logical Units (LU), I didn't see any options
for choosing a negative number. Is this a bug, a feature, or am I
missing something?
Anyhow, I picked a bin LU of 25 and wrote out the ASCII file.
I set up 10 runs, each with 200k primaries and combined the generated
output files from EVENTDAT into one and processed that to look for and
plot a histogram of the total deposited energy in the NaI. See a
snapshot of the SCORE and EVENTDAT cards.
The EVENTDAT output file looks like:
****
***** Event-Data ****
70 MeV positrons on NaI
DATE: 11/ 4/13, TIME: 16:13:48
No. of regions. 3 No. of distr. scored 2
Event # 1
Primary Weight 1. Primary Energy 0.0710219964 GeV
Contributions to the energy deposition
(GeV not normalized to the weight):
0. 0.0708008781 1.84126108E-07 0. 5.21420152E-05 0. 0.
1.49772841E-05
0. 0. 0. 0.000153813118
Generalized scoring distribution # 211
from first to last region:
3.96721152E-05 0. 0.0708008781
Generalized scoring distribution #
208 < ===== 208 is Deposited Energy
from first to last region
5.21420152E-05 0.
0.07081604 < ===== Third
number is DE in NaI
Seeds after event # 1
*** 6F38 0 0 0 0 0 53C9 A5B
0 0***
Event # 2
Primary Weight 1. Primary Energy 0.0710219964 GeV
Contributions to the energy deposition
(GeV not normalized to the weight):
0. 0.0692215636 1.38420955E-08 0. 0.00173453416 0. 0.
3.26407161E-07
0. 0. 0. 6.55581025E-05
Generalized scoring distribution # 211
from first to last region:
0.00173145905 0. 0.0692215636
Generalized scoring distribution # 208
from first to last region:
0.00173453416 0. 0.0692219064*
*...**
**...**
*
The output of my parsed file looks like this (units are still in GeV).
I didn't need to produce this file for histogram generation but did so
for checking.
*5.21420152E-05 0. 0.07081604
0.00173453416 0. 0.0692219064
0.00414068298 0. 0.0668813139
0.00056667655 0. 0.0702739432
0.000145781378 0. 0.0704984888
0.00139258709 0. 0.0696294084
...
...
0. 0. 0.0710219964
...
...
**0. 0. 0.0710219964*
...
...
*0. 0. 0.0710219964*
As you can see, every few events, I see exactly the same number: i.e.
71.0219964 MeV. I am not sure what this corresponds to. How could
deposited energy be larger than the incident beam energy of 70 MeV? And
why am I getting the exact same number repeated so frequently? I am
attaching the histogram of the deposited energy for the 2M primaries.
Thanks and best wishes,
Mina
On 13-10-28 04:31 AM, Emilio Ciuffoli wrote:
> Dear Mina,
>
> I faced a problem very similar to your; however I'm not an expert
> in Fluka (I started to use it one month ago) and hence my solution
> probably is not the best one (and, for sure, is not the most elegant one).
>
> Using the card EVENTDAT it is possible to save the energy deposited by
> every single particle in a given volume; from these information you
> can obtain your histogram. However, if you save the data in the ASCII
> format, there is a lot of text that can be annoying if you want to use
> a program to elaborate the data and obtain your plot.
>
> You can save your data in a binary file, but in this case you have to
> write a script in order to read them and to put them in a more
> accessible format. You have two possibility, at this point:
>
> 1) If you don't know the fortran language (like me) you can find an
> example of a script that reads the bin file in the FLUKA webpage on
> EVENTDAT <http://www.fluka.org/fluka.php?id=man_onl&sub=32>. I
> modified this script and my output file now is simply a string with
> the deposited energy for every event, that I can read with a C++ code
> or with Matematica in order to obtain the histogram.
> 2) If you have a better knowledge of the language, you can divide the
> events in bin directly in the fortran script, writing in the output
> file the number of events per bin
>
> As I said, however, this is definitely not the optimal solution, and I
> am quite confident that there is a better way.
>
> NOTE: technically, the card EVENTDAT gives you much more information:
> the deposited energy is divided into the energy deposited by
> ionization, by pair productions ecc... Depending on what you need, you
> can consider them separately or sum all these contributions; you just
> have to slightly modify your fortran code.
>
> Best Regards
> Emilio Ciuffoli
>
>
> 2013/10/26 Mina Nozar <nozarm_at_triumf.ca <mailto:nozarm_at_triumf.ca>>
>
> Hello everyone,
>
> What is the best way to look at the spectrum of the deposited
> energy in a given volume? What I am trying to do is to look at a
> histogram of the deposited energy.
>
> Thank you and best wishes,
> Mina
>
>

(image/jpeg attachment: positrons_on_NaI_Scoring.jpg)
(image/jpeg attachment: NaI_DE.jpg)