Date: Tue, 4 Aug 2015 10:50:46 +0300
On 04.08.2015 02:15, Roman Savinov wrote:
> Mikhail,
>
> Thank you so much for your answer, it was very helpful. I just have a
> question about the example you directed me to:
> https://indico.cern.ch/event/334606/contribution/35/attachments/653364/898409/AdvancedSources2014.pdf (pg. 38)
>
> I don't quite understand the plot in this example. Ok, they got t,
> (energyin my case) and they sample it N times but what do they do with
> thatto get the plot (MC for 3 different N-s)?
> Based on how you wrote your source routine:
> * Kinetic energy of the particle (GeV)
> c Kinetic energy in MeV
> EKIN = (EMIN1 + (EMAX1 - EMIN1) * FLRNDM(XDUMMY))
> C WRITE( LUNOUT, *) 'DEBUG EKIN: ', EKIN
>
> C Final energy in GeV
> EKIN = (C10 * DEXP(-(EKIN - C20) / C30)) * EMVGEV
> C WRITE( LUNOUT, *) 'DEBUG EKIN1: ', EKIN
>
> TKEFLK (NPFLKA) = EKIN
> where, i guess, your EKIN would be analogous to the t in the example. So, based on the way you wrote your code, I would say they plugged t back into f(x) function with t in place of x but in that case I don't see why MC should deviate from the theoretical y=-exp(-x) curve.
> Again, my question is how they obtained MC plot.
> My other, perhaps more important question is whether this is the only way to model energy distribution in fluka? For example, in MCNPX one would enter numerical values of energies and corresponding values of probabilities in source card. I saw some people did it in fluka too. Like this:
> http://www.fluka.org/web_archive/earchive/new-fluka-discuss/att-0768/source.f
> from this thread:
> http://www.fluka.org/web_archive/earchive/new-fluka-discuss/0768.html
> Hope my questions make sense.
> thanks,
> Roman
>
>
Dear Roman,
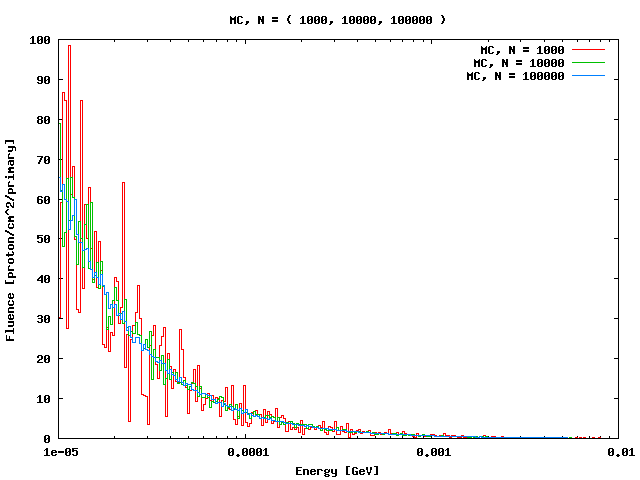
I don't know how particularly that MC plot was built, but look at my
suggestion in attachment. Just run test-1,2,3 in test.flair, merge the
data, and draw them on one plot.
About your second question, i think you should ask developers of FLUKA
code, but in any case all implementation must be done in source.f file,
of course you can load the probability distribution data from the file
(not just built-in data values as FORTRAN code). For example
<http://www.fluka.org/web_archive/earchive/new-fluka-discuss/7878.html>
generation of a x-ray tube spectrum. Basic idea was given in the same
AdvancedSources
<https://indico.cern.ch/event/334606/contribution/35/attachments/653364/898409/AdvancedSources2014.pdf>
pp. 33-36.
Best regards,
Mikhail
__________________________________________________________________________
You can manage unsubscription from this mailing list at https://www.fluka.org/fluka.php?id=acc_info
(image/png attachment: plot02.png)
- text/x-fortran attachment: source_mod2.f
- application/x-fluka attachment: test.inp
- application/x-fluka attachment: test-1.inp
- application/x-fluka attachment: test-2.inp
- application/x-fluka attachment: test-3.inp
- application/x-flair attachment: test.flair