Date: Thu, 6 Aug 2015 09:53:23 +0000
Mikhail,
sorry to bother you again but I have a problem with plotting the proton fluence of the source. I am trying to recreate results from this paper:
http://www.sciencedirect.com/science/article/pii/S2214552414000674/pdfft?md5=fa5b5ee5f3679917a4686acc3af31fc7&pid=1-s2.0-S2214552414000674-main.pdf
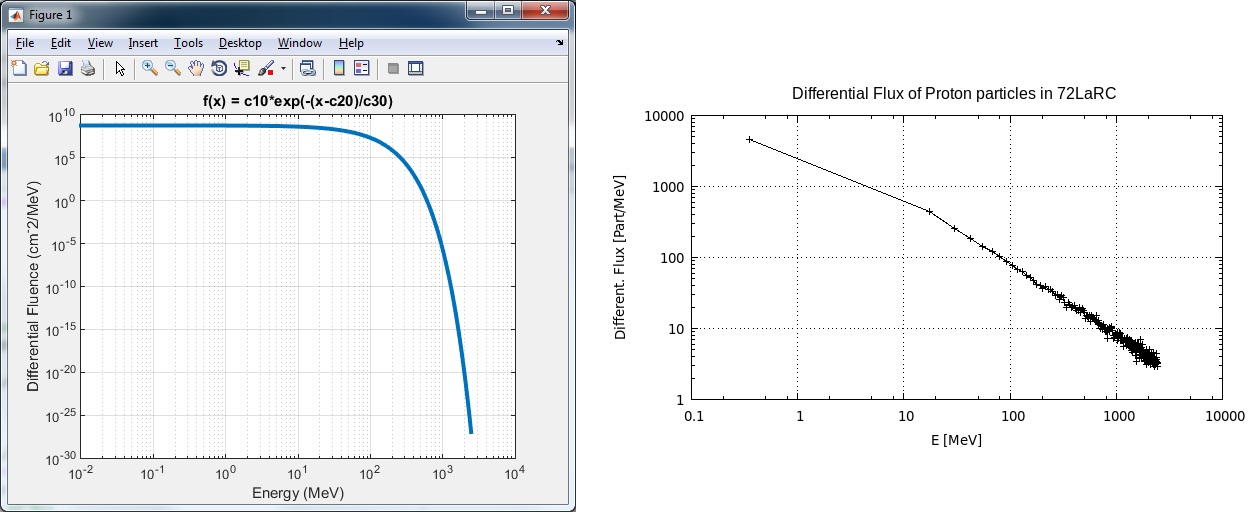
The equation from my first email, f(x) = c10*exp(-(x-c20)/c30) is given on pg.81 and describes proton fluence spectra of the August 1972 Solar Particle Event.
My current goal is to learn how to feed Fluka with that fluence spectra and using fluka make a plot of the source fluence (using USRBDX maybe?) similar to the one obtained when the function is plotted directly and thus validate that fluka gets the right input. Right now, plots are not matching and I don't understand why.
[cid:7ad14dc0-81cd-4e2b-9663-5ea5c44deb09]
Also, can you explain why in your source:
C minimum in MeV
EMIN1 = C20 - (LOG(EFMIN / C10) * C30)
C maximum in MeV
EMAX1 = C20 - (LOG((EFMAX * GEVMEV) / C10) * C30)
the EFMIN and EFMAX are values of min and max energy and not values of the function at these two points? I thought you just solved for x in the function.
finally, I don't quite understand how would fluka knows that the function describes specifically differential fluence and not any other parameter that depends on energy.
thank you,
Roman
__________________________________________________________________________
You can manage unsubscription from this mailing list at https://www.fluka.org/fluka.php?id=acc_info
(image/jpeg attachment: output.jpg)