Date: Wed, 20 Apr 2016 08:08:10 +0000
Hi Roman,
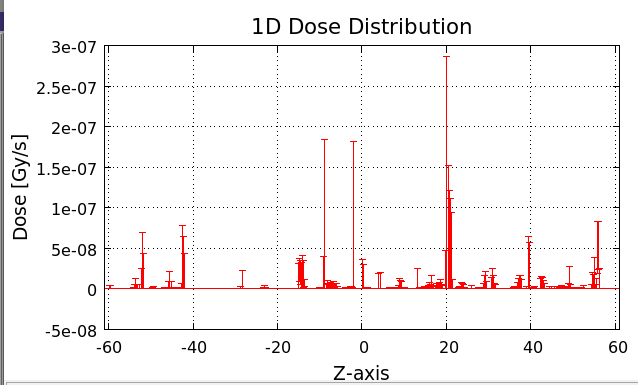
from your plot it seems you are lacking statistics to make any conclusion.
Cheers
Vasilis
________________________________
From: owner-fluka-discuss_at_mi.infn.it [owner-fluka-discuss_at_mi.infn.it] on behalf of Roman Savinov [rsavinov_at_calpoly.edu]
Sent: Tuesday, April 19, 2016 09:31
To: fluka-discuss_at_fluka.org
Subject: [fluka-discuss]: Dose profile due to GCR
Dear FLUKA experts,
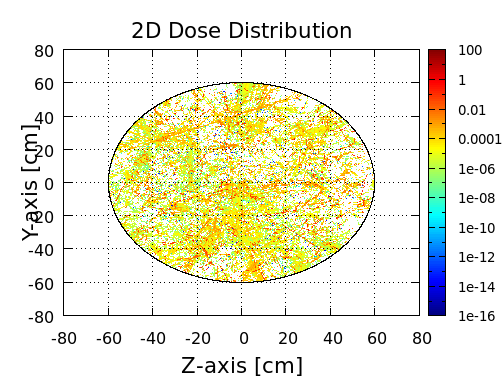
I have an emission sphere of GCR and a spherical water target. My expectation is that I should get a decreasing profile of dose distribution along the target radius (highest value on the surface, lowest toward the center). However, what I do get is a randomized dose distribution:
[cid:41dea6d6-3c88-4fcb-8e30-b5ff9e6dcda9]
[cid:c207fa74-bcca-42ad-813f-91510476a639]
Looks like 60 cm of water shows no attenuation whatsoever.
Can someone take a look at my input file and let me know what I do wrong?
I also include 6 GCR source files for the proton to carbon nuclei.
thank you,
Roman
__________________________________________________________________________
You can manage unsubscription from this mailing list at https://www.fluka.org/fluka.php?id=acc_info
(image/png attachment: pastedImage.png)
(image/png attachment: 02-pastedImage.png)