Date: Mon, 4 Jun 2018 13:53:17 +0000
Dear Paola,
Thank you very much for all your help - I really appreciate it.
That was indeed the issue.
Many thanks,
Ana
________________________________
De: paola sala <paola.sala_at_cern.ch>
Enviado: 11 de maio de 2018 08:01:13
Para: Ferreira De Almeida Lourenco, Ana; fluka-discuss_at_fluka.org
Assunto: Re: [fluka-discuss]: Proton beams: deltarays artefacts
Dear Ana
as a general rule, it is never a good ida to set different delta ray or transport thresholds in neighboring "interesting" regions, because the electronic equilibrium will be lost. Think to your case: deltas are produced only in one part of the target (let's call T10 , so they can travel to the other parts, depositing energy far from the production point. T1 instead will not receive similar contibutions from the other target segments, where deltas are not produced --> unbalance.
Why then in your case you get more energy ( would expect less in T1 from previous consideration) ? Probably because there is a typo in your input, the average ionization energy is never changed for medium WATER1, while it is changed for medium WATER.
As I always say, ALWAYS look at the output file and check:
Material n. 26(WATER ) matched to WATER
***** dp/dx : material number 26 "WATER " *****
***** Average excitation energy : 7.8000E+01 eV, weighted Z/A : 5.5508E-01
Material n. 27(WATER1 ) matched to WATER
***** dp/dx : material number 27 "WATER1 " *****
***** Average excitation energy : 7.5000E+01 eV, weighted Z/A : 5.5508E-01 *****
hope this helps (I did not do the final check)
Paola
On 05/01/2018 05:20 PM, Ferreira De Almeida Lourenco, Ana wrote:
Dear Fluka experts,
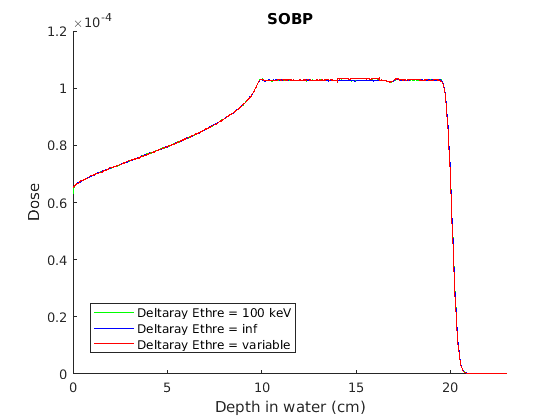
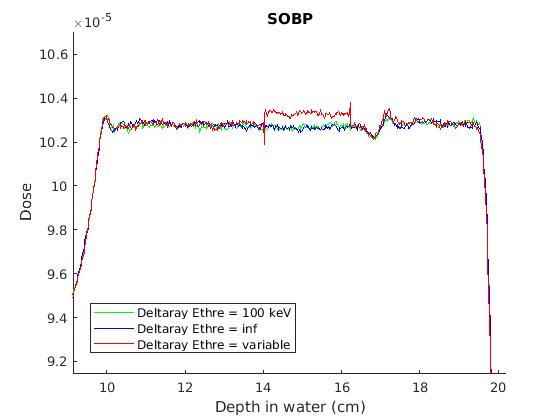
I'm simulating a SOBP in water with different deltaray thresholds as it can been seen in figure 1 below. The most energetic secondary electrons have a short range of <1 mm and therefore all energy transferred to electrons can be regarded as absorbed locally, thus, there is no difference between a depth dose-curve when using the default 100 keV deltaray threshold (green curve) or using an infinite threshold (blue curve). The curve in red results of a simulation with different transport parameters where in the middle of the SOBP (in the region between 14-16 cm) there is a "more accurate" transport. Figure 2 shows the middle of the SOBP in more detail. In this region, particles are transported with smaller step sizes and electrons are transported down to 1 keV. These parameters were optimised in previous simulations to obtain a particle transport accuracy better than 0.15%, important to model the response of ionization chambers.
Looking at the results in figure 2, it seems that there is an artefact in the energy balance. Why is the dose higher in the middle of the SOBP for the simulation with a more accurate energy transport? How can I correct for this artefact?
Attached the input files and the source file.
Many thanks,
Ana
[cid:part1.CB126BF1.2C03E167_at_cern.ch]
Fig 1
-----------------------------------------------------------------------------------------------
[cid:part2.959E4DCE.671397B6_at_cern.ch]
Fig 2
__________________________________________________________________________
You can manage unsubscription from this mailing list at https://www.fluka.org/fluka.php?id=acc_info
(image/png attachment: untitled.png)
(image/png attachment: untitled2.png)