Date: Sat, 29 May 2010 22:22:08 +0200
Hi Stefan,
to make the plot in the original post I've been using a customized
FLUKA, which can produce all the "event tape" in the ROOT format. That's
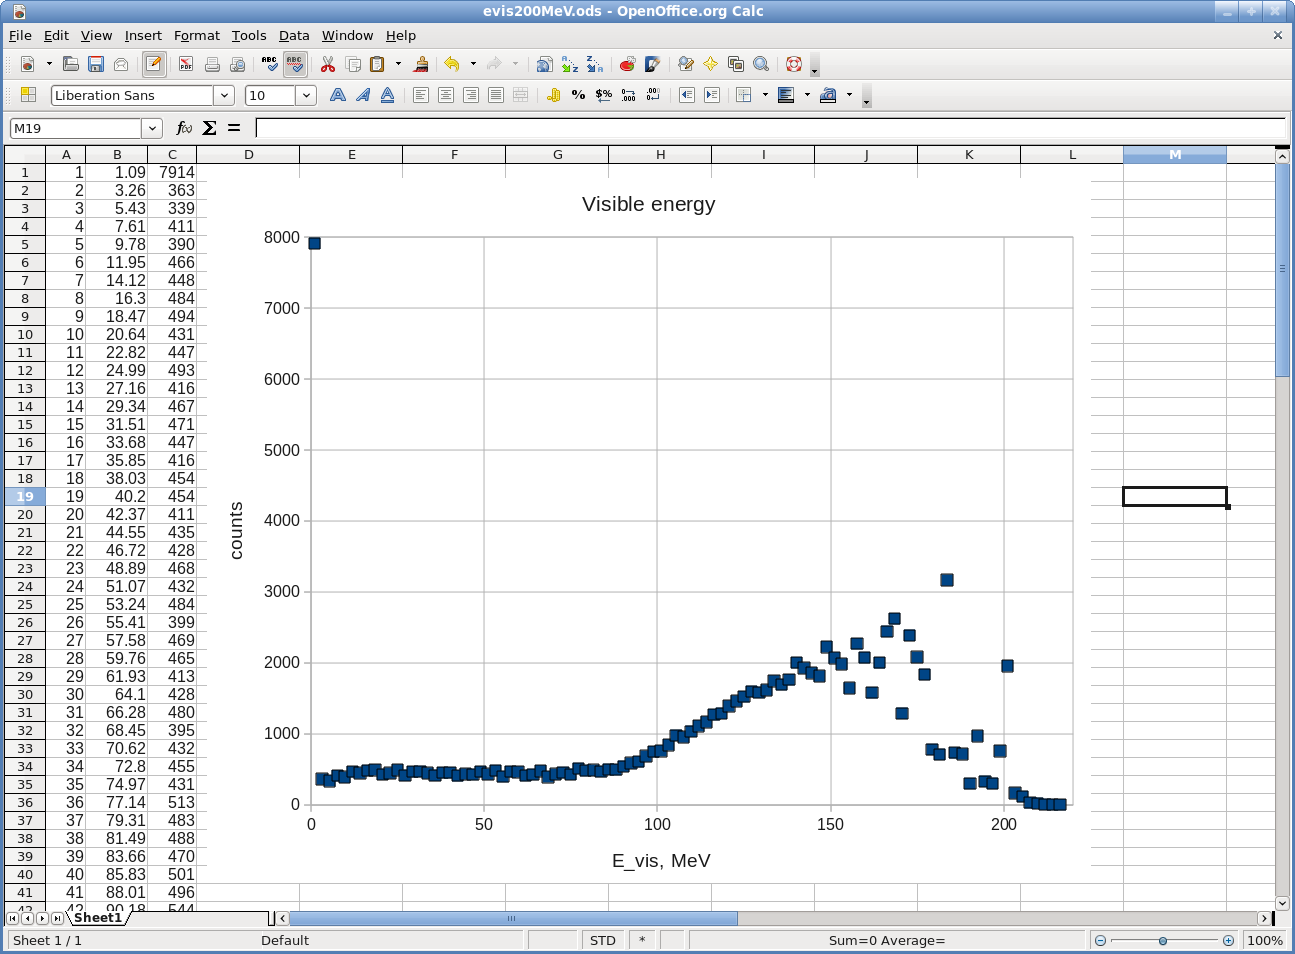
quite a lot of code... In order to show, that "spikes" on the visible
energy spectrum is produced by FLUKA, but not by the code "overhead"
I've made a minimal customization, which doesn't use any external
libraries - it attached as "fluka_custom.tar.gz" - there you can all
the modified user routines and Makefile. All the customizations in
routines can be easily localized - the are using the exclamation mark
"!", not the asterisk "*" as the comment symbol. In
"fluka_input.tar.gz" you can find input files, which are using the
customized "testfluka" executable. After running them you may find at
the end of *.log file a comma-separated data, which is a the histogram
for visible energy. I've also attached a screenshot with a plot of
visible energy spectrum which is made in OpenOffice using the latter CSV
data. As you can see, "spikes" on this plot are huge...
Best regards,
Vassili
On 05/28/2010 06:30 PM, Stefan Roesler wrote:
> Hi Vassili
>
> Could you please post any routine which you used for scoring? It is hard
> to tell from the input only.
>
> Thanks,
>
> Cheers
> Stefan
>
>
> On Fri, 28 May 2010, Vassili Maroussov wrote:
>
>
>> Dear FLUKA experts,
>>
>> With a simple problem setup - neutron beam hitting 2x2x2m^3 scintillator
>> cube - I'm observing strange statistically relevant oscillations of the
>> visible energy spectrum (an the higher spectrum edge). These oscillation
>> appear for neutron energy around 200MeV. What can be a reason for them?
>>
>> Best regards,
>>
>> Vassili
>>
>>
>>
>
- application/x-gzip attachment: fluka_custom.tar.gz
- application/x-gzip attachment: fluka_input.tar.gz