Date: Fri, 19 Jul 2013 18:19:54 -0700
Hello everyone,
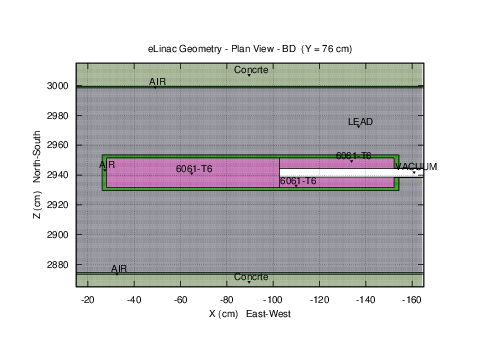
We are working on optimizing the shielding for a 100 kW (75 MeV, 1.3 mA)
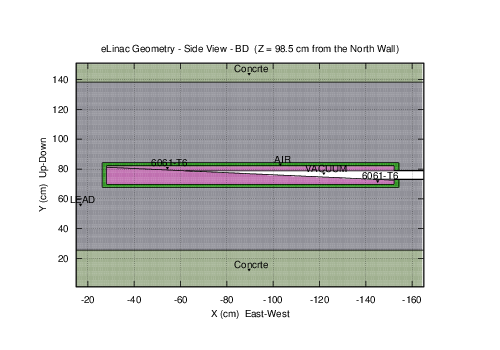
electron beam dump. BD is basically a chunk of Al with a slanted plane
in the middle to distribute the incident beam (square in shape 4x4 cm).
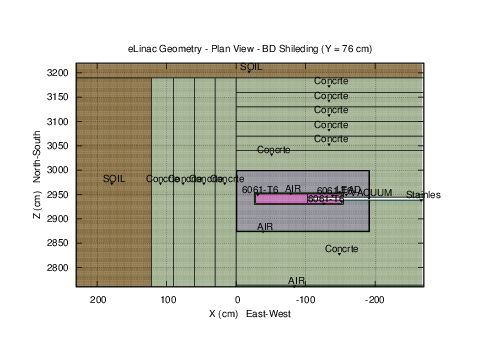
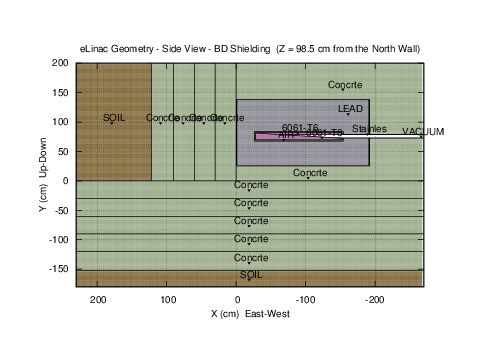
The BD is surrounded with lead and concrete, lead and polyethylene (PE),
or lead and borated PE(BPE) depending on the study. The BD is 111 cm
long, 20 cm wide, and 12.5 cm high.
In order to compare thickness of PE, BPE, or concrete required in
shielding neutrons and finding the minimum thickness of lead required to
bring down the dose rates from photons to meet different limits, I have
been looking at dose rate distributions from neutrons and photons
separately.
I have set the production and transport thresholds for e+/e- to 100 keV
and 10 keV for photons.
I originally thought if I extracted TVL from the attenuation of photons
in lead and neutrons in concrete (PE/BPE), I could find the required
thickness of each material to reduce the dose rates down to the limits.
However, I have observed a 'build-up' behaviour of photons in lead that
I don't understand (and which is affecting my conclusions). I would
like to find out whether this is a by product of geometry effects,
thresholds set, etc. or if this is a real build-up effect I am
observing, suggesting that past some thickness, the effectiveness of
lead to shield photons goes down.
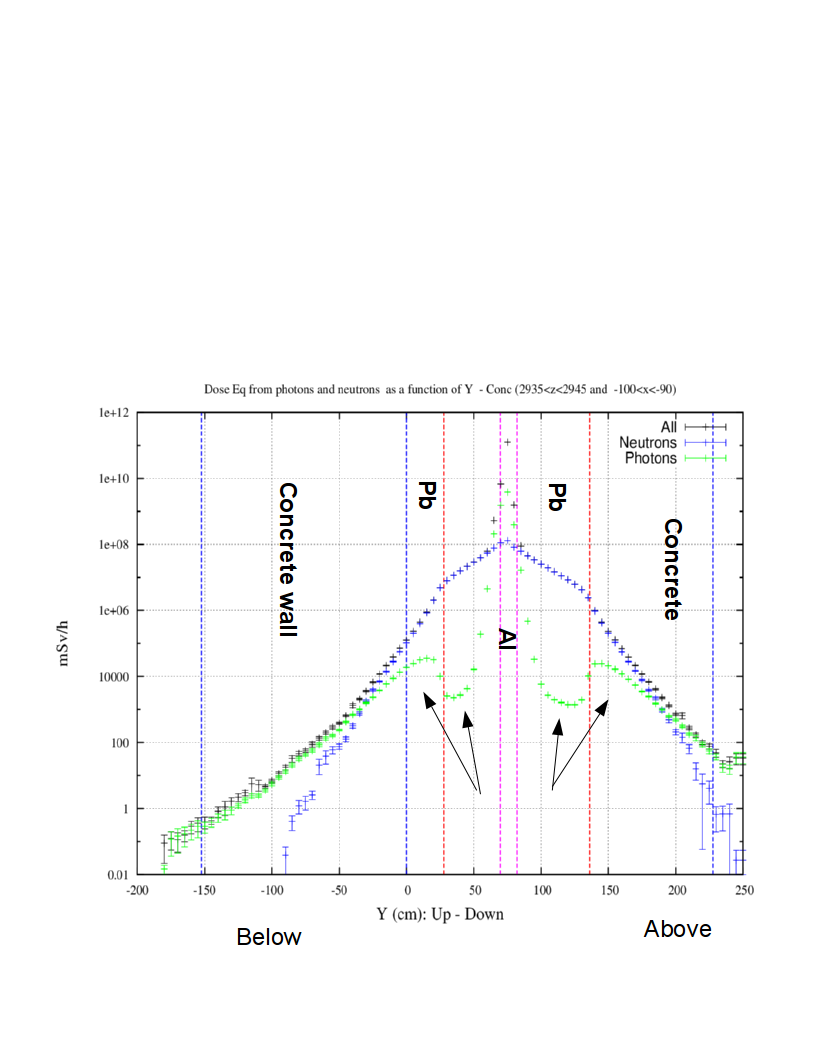
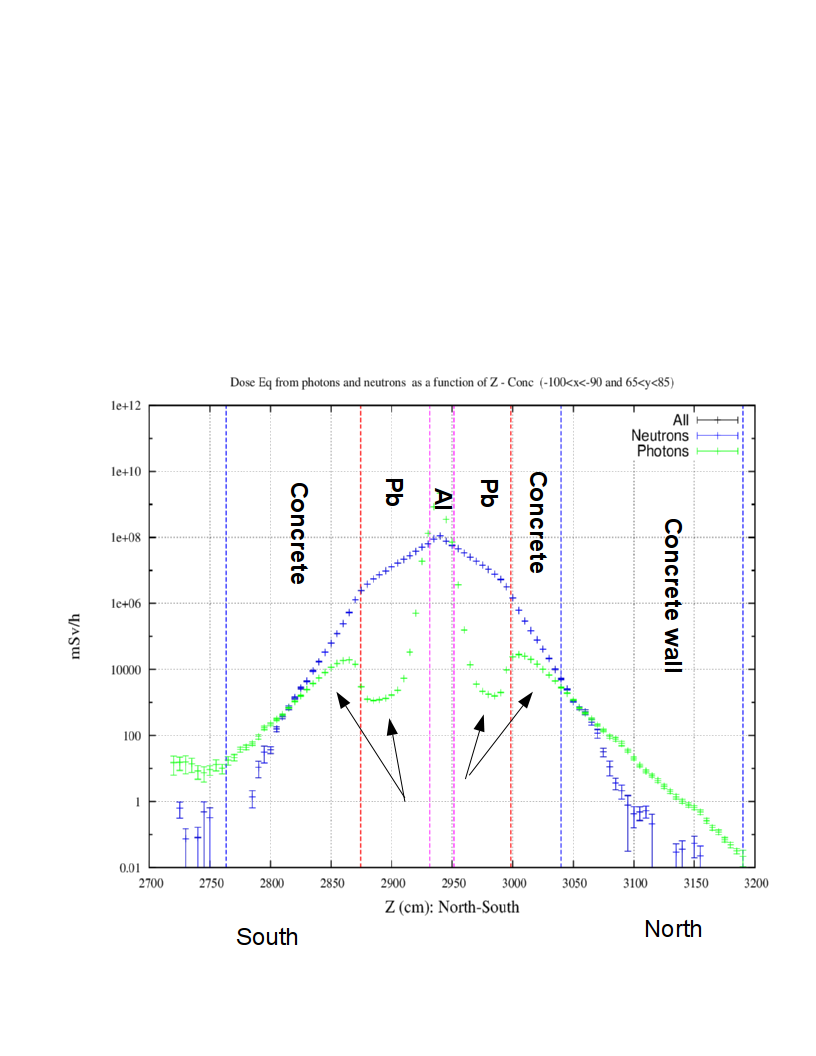
I am attaching plan and side views of the geometry around the BD and two
figures showing 1-D distributions of the dose rates (from neutrons,
photons, and total), as a function of width and height of the BD. The
slices I have made are 10 cm wide around the beam line and center of the
beam dump. The arrows point to the areas showing the 'build up'
feature which continues through the lead/concrete boundary.
I am showing results of the lead and concrete study only but I observe
the same behaviour for lead and PE.
Thank you very much for any insight you might have on this. I
Best wishes,
Mina
(image/png attachment: geom_planView_BD.png)
(image/png attachment: geom_planView_BD_Shileding.png)
(image/png attachment: geom_SideView_BD.png)
(image/png attachment: geom_SideView_BD_Shiedling.png)
(image/png attachment: eLinBD2_DoseEq_Photon_and_Neutron_Y.png)
(image/png attachment: eLinBD2_DoseEq_Photon_and_Neutron_Z.png)