From: Nima Ghal-Eh <Nima.Ghal-Eh_at_fuw.edu.pl>
Date: Thu, 15 Sep 2016 00:33:56 +0430
Dear FLUKA experts,
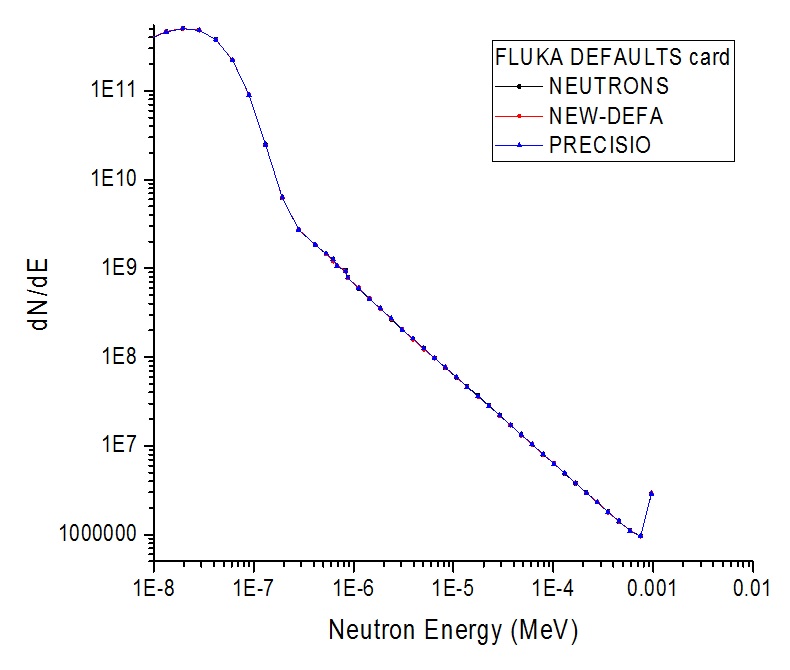
I would like to calculate the neutron fluence distribution in a 10-cm
radius light water sphere when a 1-keV isotropic neutron source is
located at the center. As you may see in Fig. 1 attached to this
message, there is a peak at 0.001MeV of usrtrack spectrum as one may
expect and then the spectrum represents an increasing behavior when
going to lower energy region with a relatively large slope.
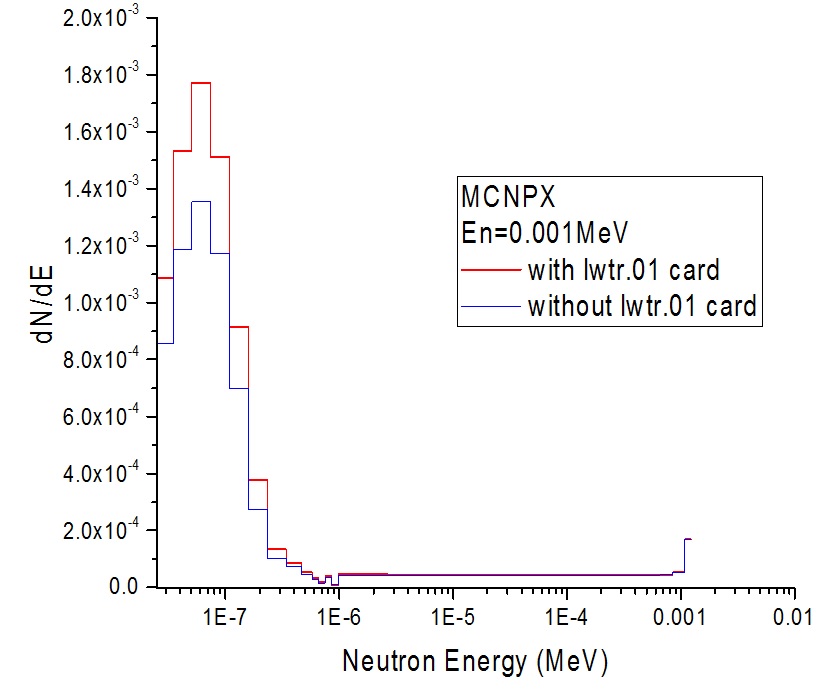
My experience with tally F4 of MCNPX code (Fig. 2) says that the slope
of the spectrum shouldn't be like the one seen in Fig. 1.
Could you please kindly tell me how to interpret this difference?
Best regards and looking forward to hearing from you.
Nima.
__________________________________________________________________________
You can manage unsubscription from this mailing list at https://www.fluka.org/fluka.php?id=acc_info
Received on Wed Sep 14 2016 - 23:27:27 CEST