Date: Mon, 3 Oct 2016 05:20:45 +0000
Dear Hamideh,
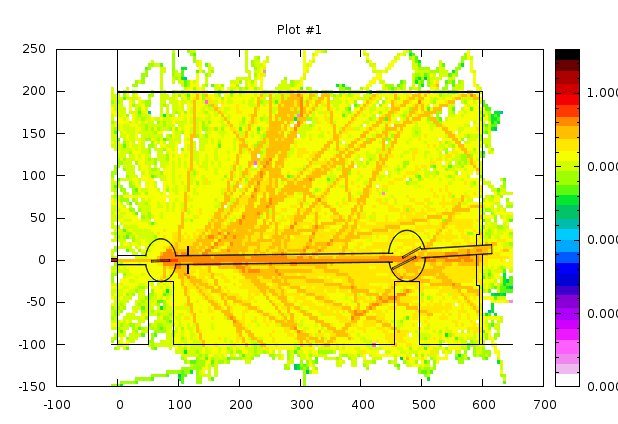
For flair plotting questions, please always attach the flair file such that one can reproduce the problem. I assume that your attached Y-Z plot is the dose-eq average over X (i.e. I assume you did not restrict the X range when plotting in flair)? If you then select "-Auto-" for including the geometry boundaries in your plot, flair will take the Y-Z cut at the center of your X range which is at X=-75 cm since your X USRBIN boundaries are -310cm and 160cm. I assume when you say you want more details, you mean you want the Y-Z cut at X=0.0? This can be easily achieved by specifying "0.0" in the "Pos" field just below "-Auto-". Then you get a plot like the attached one (I only ran a few particles, hence the bad statistics).
I cannot comment on your issue with SimpleGeo. I let SimpleGeo-experts answer this question.
Cheers, Anton
________________________________
From: owner-fluka-discuss_at_mi.infn.it [owner-fluka-discuss_at_mi.infn.it] on behalf of Hamideh Jalali [jalali.hb_at_gmail.com]
Sent: 01 October 2016 13:47
To: fluka-discuss
Subject: [fluka-discuss]: Plotting usrbin results in geometry
Dear FLUKA Experts
I would like to have the usrbin results in simulated geometry so I selected option "auto" in geometry part of usrbin 2D projection plot but the usrbin result is shown merely in the framwork of geometry without showing the details of simulated geometry.
I also have the problem with plotting this geometry in SimpleGeo program. This program is closed when I use automatic update while the geometry part of flair can correctly plots the geometry in different planes.
Could you help me what the problem is.
Best Regards
Hamideh
ps, the input file is attached.
__________________________________________________________________________
You can manage unsubscription from this mailing list at https://www.fluka.org/fluka.php?id=acc_info
(image/png attachment: geoflair.png)