|
|
|
|
Quick launch:
Last version:
News:
--
Fluka Release
|
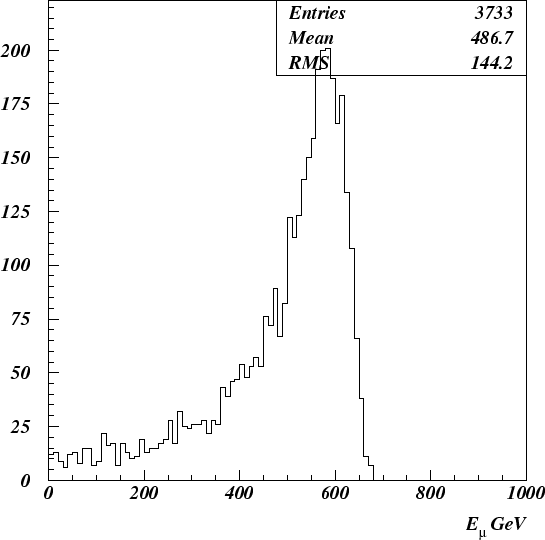
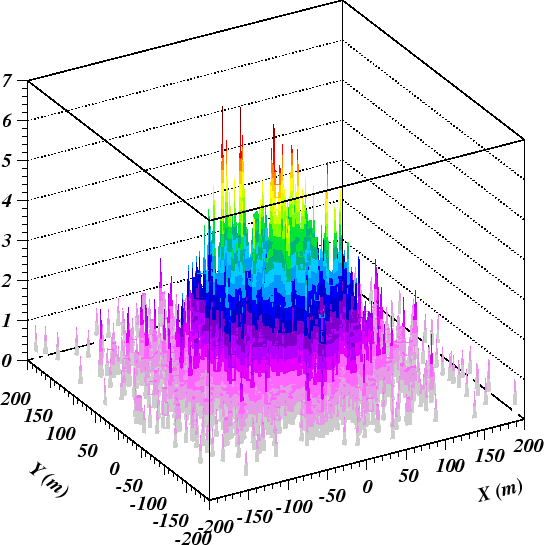
[ 1 ] [ 2 ] [ 3 ] [ 4 ] [ 5 ] [ 6 ] [ 7 ] [ 8 ] [ 9 ] [ 10 ] [ 11 ] [ 12 ] [ 13 ] [ 14 ] [ 15 ] [ back ] The total number of handled cases must be checked in the seamu00n.out files. The number of survived muons will be given by the number of entries in the ntupla. In fig. 2 we show the plot of muon residual energy and in fig. 3 we plot the distribution of transverse coordinates of survived muons at detection level.
These plots can be obtained by means of a simple "kumac" like the following one: * merging hbook ntuples nt/hmerge seamu.his seamu001_hbk.his seamu002_hbk.his seamu003_hbk.his his/fil 1 seamu.his * checking the content of the ntupla nt/print 100 * booking the 1D histogram of residual energy 1dh 10 ' ' 100 0. 1000. 0. * projecting on the histogram nt/proj 10 100.eres his/plo 10 atit 'E?[m]! GeV' * booking a 2D histogram of X vs Y muon coordinates 2dh 20 ' ' 100 -200. 200. 100 -200. 200. 0. nt/proj 20 100.ymu%xmu opt nsta h/plo 20 surf2 atit 'X (cm)' 'Y (cm)'
Giuseppe Battistoni; INFN, Milano
Last updated: 10th of December, 2008 |


© FLUKA Team 2000–2025