Date: Mon, 4 Sep 2017 16:55:21 +0530
Dear All
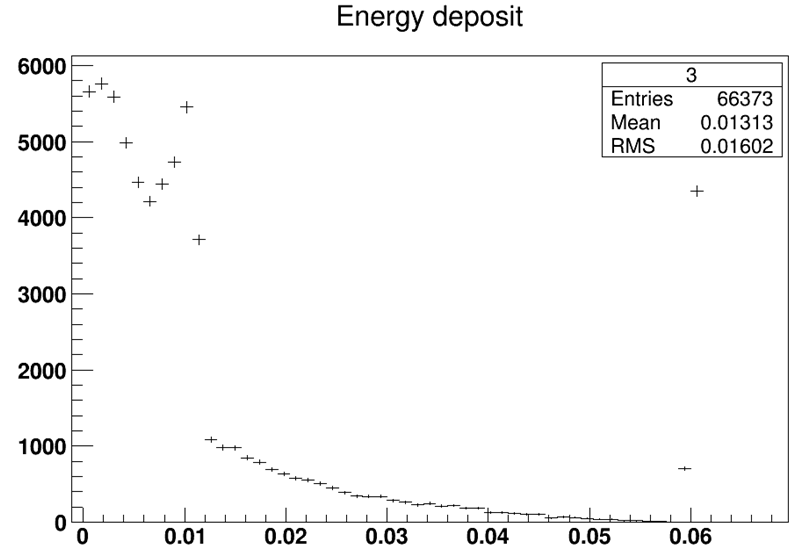
I have obtained following spectrum using DETECT card in FLUKA for 60 keV
gamma falling on 10 micron silicon detector. Here Y-axis is number of
events and X-axis is energy deposit in that event in keV.
[image: Inline image 1]
there was no counts between compton edge (20 keV) and photo peak (60 keV)
but experimental results or results obtained using GEANT4 suggest some
counts between these to points and I found some where that these points are
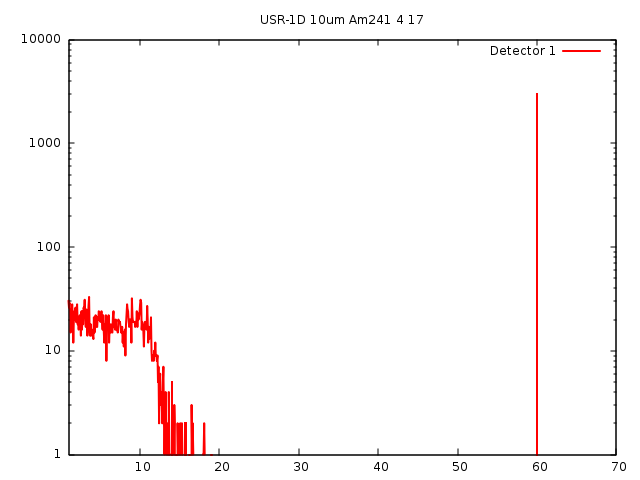
due to multiple compton events. Following is a similar spectrum obtained
using GEANT4
[image: Inline image 2]
I have doubt whether FLUKA simulates multiple compton events. Please let me
whether I am missing any necessary card to account multiple compton events.
My input file is attached.
--
Amit Kumar
__________________________________________________________________________
You can manage unsubscription from this mailing list at https://www.fluka.org/fluka.php?id=acc_info
(image/png attachment: image.png)
(image/png attachment: 02-image.png)
- chemical/x-gamess-input attachment: 10um_Am241_4.inp