Date: Tue, 21 Aug 2018 19:31:31 +0000
Dear Anton,
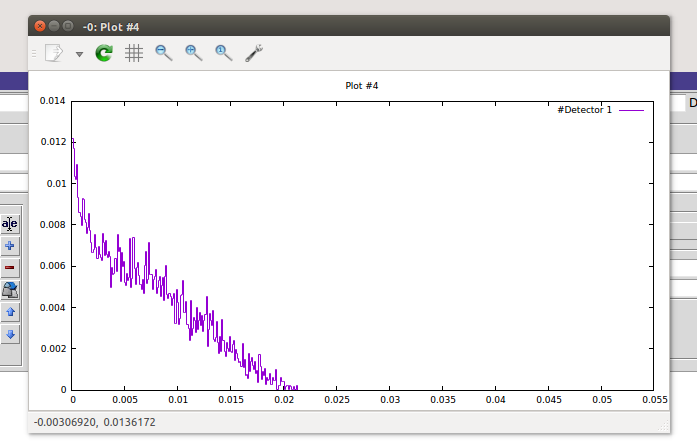
Thanks for advising on this. I was able to plot a 1D profile of the energy deposition (at least I believe I did).
I have a follow-up question. It is possible to output the data from the graph directly?
Inside the output folder, I saw a file with name - score_52_plot.dat( I have update the program with 40 change to 52 and number of bins in the x-direction changed from 30 to 1). My understanding is that the value in the 3rd row is the energy deposition in GeV/cm. What about the boundaries corresponding to these values of Edep (the z-ordinates) ?
Thanks,
Modest
________________________________
From: Anton Lechner <Anton.Lechner_at_cern.ch>
Sent: Tuesday, August 21, 2018 11:59:26 AM
To: Tchakoua Tchouaso, Modeste; fluka-discuss_at_fluka.org
Subject: RE: Energy Deposition
Dear Modeste,
The energy deposition entries (GeV/cm3) of your cartesian mesh are written after the statement "accurate deposition along the tracks requested" in the "score_40.bnn.lis" file (there are 15000 numbers since you have 30x1x500=15000 bins). The individual bin boundaries are not explicitly written in the file, but can be easily calculated from binning coordinates (min, max, number of bins) shown at the top of the file. If you want to process the data yourself you need to read in the energy density values by looping over the three coordinates (3 nested loops). However, Flair has already such plotting and data processing functionalities included. If you want to plot the energy deposition projected on one axis (eg. z-axis) this can be easily done with Flair (1D projection). Otherwise you need to do such manipulations manually.
The statistical errors of the bin entries then follow in the same order after the line "Percentage errors follow in ...".
Cheers, Anton
________________________________
From: owner-fluka-discuss_at_mi.infn.it [owner-fluka-discuss_at_mi.infn.it] on behalf of Tchakoua Tchouaso, Modeste [tmt6z4_at_mail.missouri.edu]
Sent: 21 August 2018 17:34
To: fluka-discuss_at_fluka.org
Subject: [fluka-discuss]: Energy Deposition
Dear Expert,
I am new to Fluka and would like to benefit from your expert knowledge.
I am considering plotting the energy deposition profile using the USRBIN score card with an external package. I ran the simulation in Flair, processed the data and exported it to ascii format. I am wanting to plot the energy deposition vs distance(in the z-axis) but not sure where to find this information from the output file.
Attached is the output file. Any help will be highly appreciated.
Modeste
__________________________________________________________________________
You can manage unsubscription from this mailing list at https://www.fluka.org/fluka.php?id=acc_info
(image/png attachment: Capture.PNG)
- application/octet-stream attachment: score_52_plot.dat
- application/octet-stream attachment: score_52_plot.geo.dat