Date: Wed, 14 Aug 2019 01:34:06 +0000
There is a non-secretive, yet slightly buggy way to do it (but I am sure someone has a workaround):
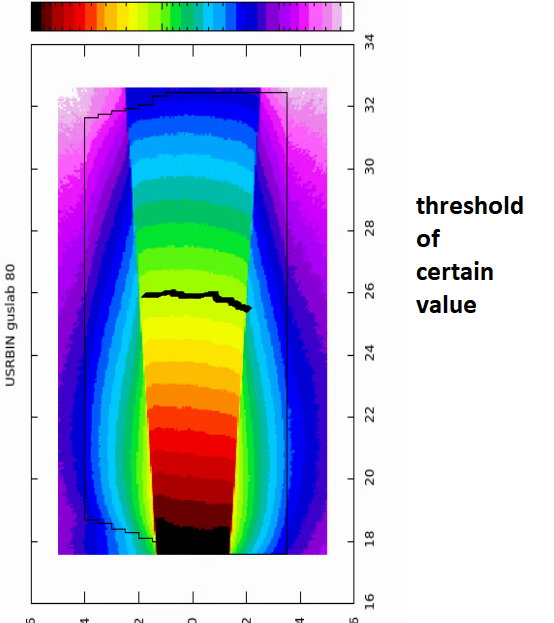
(I am assuming this is with Flair plot, not geoviewer)
Add something like the following 2 lines in the gnuplot command line:
set contour base
set cntrparam level discrete num1,num2
where num1 and num2 are two values you want isocontour lines to be added
you will notice gnuplot does produce the plot but crashes.
________________________________
From: owner-fluka-discuss_at_mi.infn.it <owner-fluka-discuss_at_mi.infn.it> on behalf of Ševčik Aleksandras <aleksandras.sevcik_at_ktu.edu>
Sent: Tuesday, August 13, 2019 11:56 AM
To: fluka-discuss_at_fluka.org <fluka-discuss_at_fluka.org>
Subject: [fluka-discuss]: drawing threshold of the certain value
Dear experts,
Is the any secret way how to draw the certain threshold lines on the plot which is produced by Flair , see picture?
Thank you very much
Alex
[cid:image001.png_at_01D55221.FB128130]
__________________________________________________________________________
You can manage unsubscription from this mailing list at https://www.fluka.org/fluka.php?id=acc_info
(image/png attachment: image001.png)