Date: Thu, 19 Mar 2020 10:25:23 +0000
Dear Mario
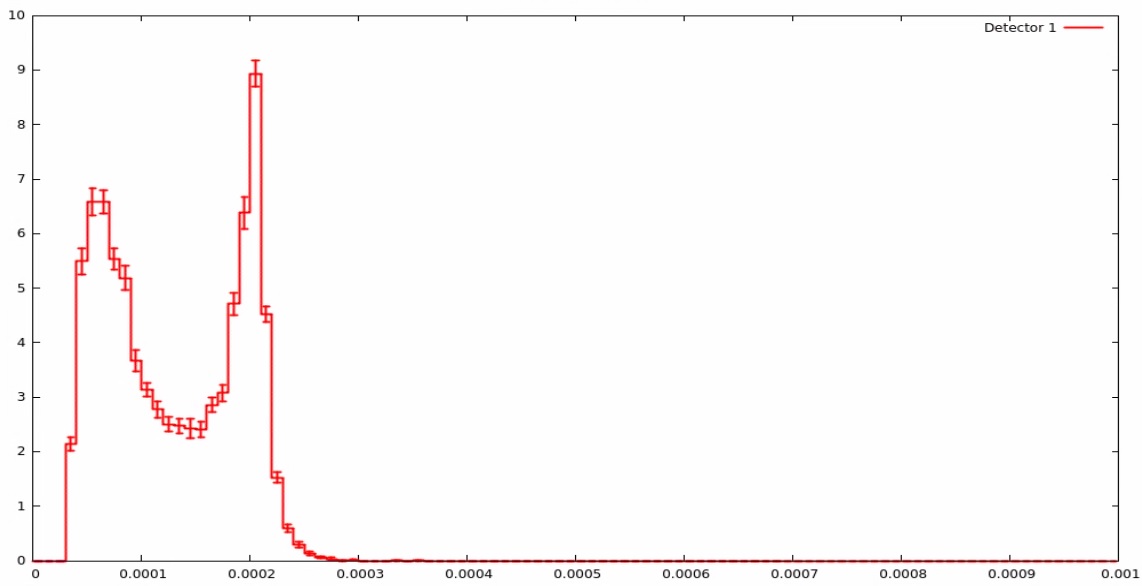
Thank you for point out the mistake. Could you please help in explaining the interpretation of the graph I have attached which I got with the following USRYIELD in layman terms:
*...+....1....+....2....+....3....+....4....+....5....+....6....+....7....+....
USRYIELD 1401. PHOTON -26. TARGET TARGET1 yield4
USRYIELD 0.001 0.0 100. 2. 1.5 3. &
As far as I understand:
* I need Y-axis to show the kinetic Energy of the scattered photons; However, the quantity I am getting is not this most likely because of wrongly chosen WHAT(12) – what it gives me?. Which WHAT(12) option should I use to see kinetic energy of the scattered photons?
* X-axis shows us the angle rage 2.5-3.1415 rad divided by 100 bins ?
* TARGET > TARGET1 means the boundary where the scattered photons are crossing?
Thank you very much for elaborative explanation. Course slides I have could not help me much, unfortunately.
Rgds
Alex
From: Santana, Mario <msantana_at_slac.stanford.edu>
Sent: Thursday, March 19, 2020 02:46
To: Ševčik Aleksandras <aleksandras.sevcik_at_ktu.edu>
Cc: fluka-discuss <fluka-discuss_at_fluka.org>
Subject: Re: [fluka-discuss]: use of usryield for energy/angle plot
Hi Aleksandras,
In flair empty plots usually are not plotted and you get a plot error message instead. This is what is happening in this case.
The reason is that you are requesting USRYIELD at the interphase between TARGET1 and _at_LASTREG, but @LASTREG=TARGET1, thus nothing can be scored.
(Also note that in your input file you have comments referring to cylindrical targets but instead you are using cubes)
-M
On Mar 17, 2020, at 9:22 AM, Ševčik Aleksandras <aleksandras.sevcik_at_ktu.edu<mailto:aleksandras.sevcik_at_ktu.edu>> wrote:
Dear Fluka experts,
I am trying to utilize USRYIELD to be able to create the scattered photon plot , energy vs angle as per attached example.
I created the several usryield detectors as I understood from the tutorial courses as well as from some examples, see the attached inp file.
However, I am unable to plot any of them – when trying to do so, getting plot errors and nothing more.
Could someone point out my mistake and how I could gather the required data to plot energy vs angle in this case – I would appreciate so much a detail explanation,
Alex
<example.png><scatter.inp>
__________________________________________________________________________
You can manage unsubscription from this mailing list at https://www.fluka.org/fluka.php?id=acc_info
(image/jpeg attachment: plot_usryield.jpg)

(image/jpeg attachment: usryield.jpg)