Date: Fri, 4 Sep 2020 08:22:15 +0000
Dear FLUKA experts,
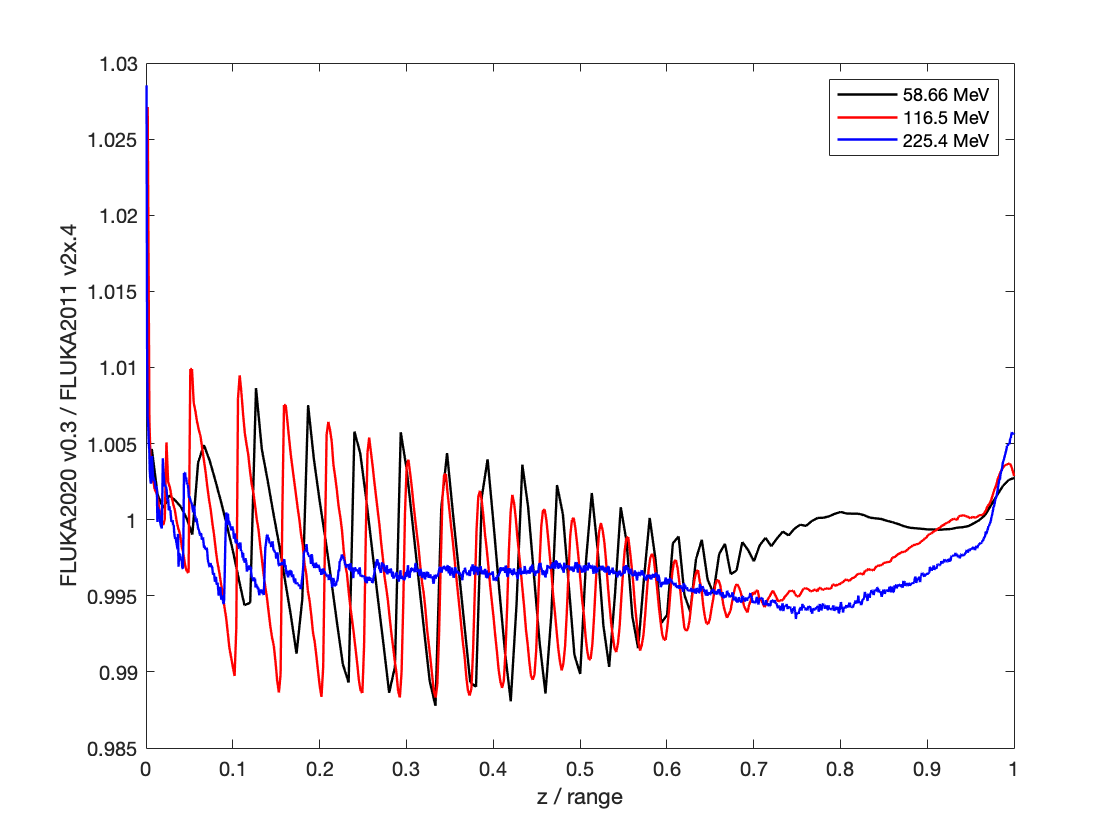
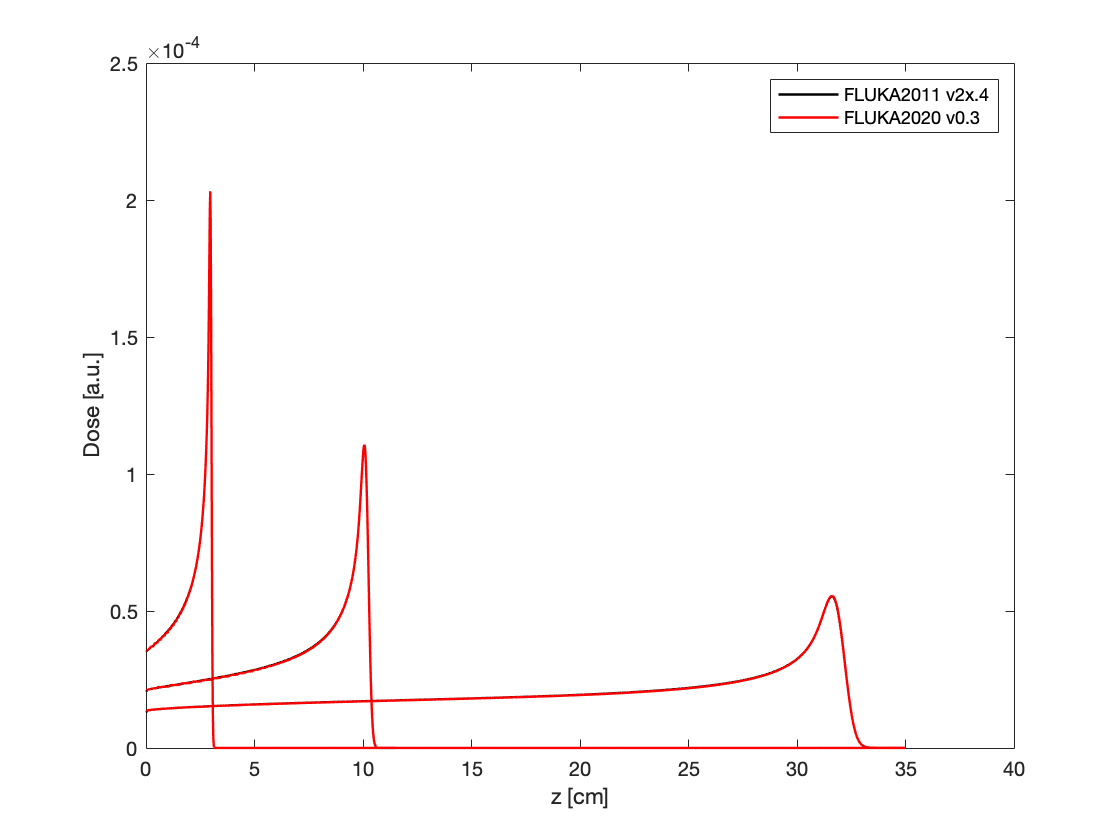
I'm simulating proton beams (beamlets) of various clinical energies (50-250 MeV) in water and scoring dose in function of depth. I've run these simulations with the FLUKA 2020 Version 0.3 and compared with previous results from FLUKA 2011 Version 2x.4 (same input file). Below the ratio of dose in function of depth obtained with FLUKA 2020 and FLUKA 2011 for three energies (figure 1).
The artefacts at shallow depths (figure 2 and 3) seem to be related with particle step sizes or energy production thresholds. Looking at the output files, different particle thresholds are being used although the input cards are the same.
I'm not sure what I may be doing wrong. What have changed between versions that could explain these results?
Example of input and output files attached.
Many thanks and best wishes,
Ana
Figure 1 - Ratio of dose in function of depth
[cid:57feb0e6-aca2-4c7a-8a5f-6a4e96913ea0]
Figure 2 - Depth-dose curves
[cid:c2d4ad39-a36c-4dc8-916c-13cd8df34f01]
Figure 3 - Zoom at shallow depths of depth-dose curves
[cid:c9acf02a-9c9c-4f6f-bf10-8c0431ddd375]
__________________________________________________________________________
You can manage unsubscription from this mailing list at https://www.fluka.org/fluka.php?id=acc_info
(image/png attachment: Outlook-d2vnbpfx.png)
(image/png attachment: Outlook-elboysa5.png)

(image/png attachment: Outlook-dt4pyvwy.png)
- application/octet-stream attachment: b_1_2_5001_FLUKA2011.out
- application/octet-stream attachment: b_1_2_13001_FLUKA2020.out
- application/octet-stream attachment: b_1_2_1.inp