Date: Wed, 10 Nov 2021 11:36:49 +0330
Dear FLUKA experts
I found a slide in the "Scoring physics quantities [II]" presentation in
the "Beginner online training, Fall 2020" about plotting USRBDX results. In
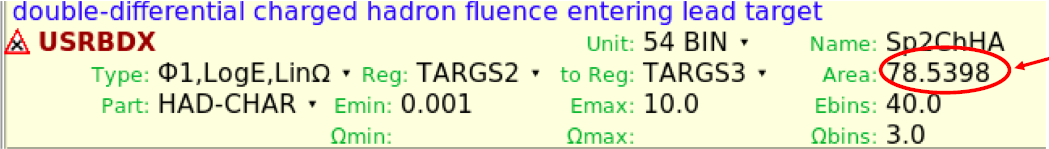
this presentation a USRBDX card has been defined as follows:
[image: image.png]
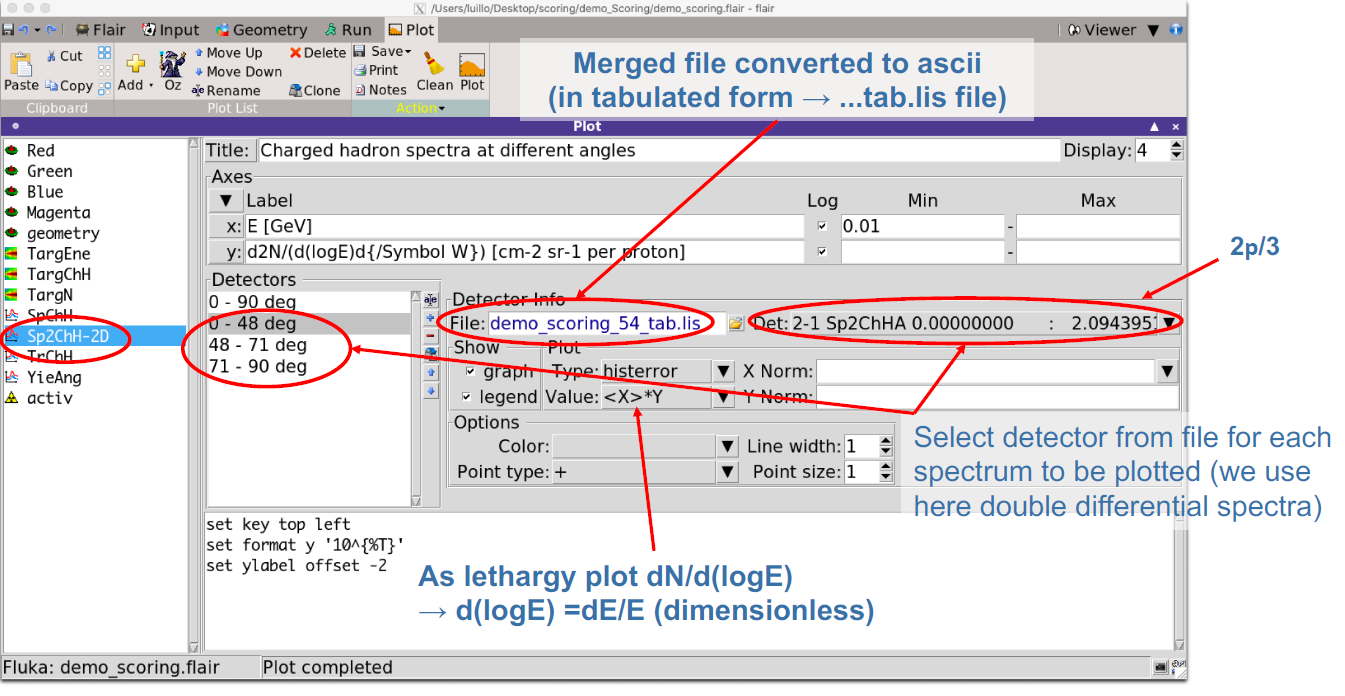
3 angular bins have been considered for the scoring. For plotting the
double differential results we have this slide:
[image: image.png]
In this slide, the first angular bin (0 to 2pi/3) has been considered for
plotting.
My question: How could the results be plotted for ranges of
0-48,48-71,71-90 and 0-90 from this detector?
Best Regards
Hamideh
__________________________________________________________________________
You can manage unsubscription from this mailing list at https://www.fluka.org/fluka.php?id=acc_info
(image/png attachment: image.png)
(image/png attachment: 02-image.png)