Date: Wed, 17 Nov 2010 08:48:08 +0100
Dear Fluka users,
thank you for the previous reply on USRBIN
processing, I cope with the problem; I forgot
to mention I am using the 2010 pre-release 0.8-4.
I would be grateful to have a check of my
analysis with you, since I am a Fluka
beginner. My problem/input file is in
attachment (inside the folder: 1E7 biasing). I
have some questions on my results (I give in
attachment also the USRBIN and USBRDX scores
for 1E7 ran particles with and without biasing applied).
My geometry is quite simple: a target made of
UC2 directly impinged by a proton beam
(300microA, 70MeV), within a concrete target bunker.
I am interested in the neutron fluence in the shielding.
I ran 1E7 particles and 3 cycles. I have some
specific questions I have tried to list here below:
- To see if neutrons are actually
produced I used a USBRDX card to get the neutron
spectrum out of the target; I saw from the
output file that the number of stars per proton
is nearly 6E-2 and the 95% is reached in terms
of percentage. Can this confirm that the numbers of primaries is enough?
- What is a reasonable standard deviations
for the results (readable from the usrbin and
usrbdx files produced after prcessing)?
- For USRBIN fluence graph I normalized
by 1,87*10**15 p/s (being the proton beam
300microA) to get results in terms of n/(cm2
s); For USRBIN energy deposition graph should I
use the same factor 1,87*10**15 p/s to get
results in terms of GeV/(cm3 s)? If I need
deposition on an unit area (per cm2) should I multiply for which length?
For the same graph if I want to convert GeV/(cm3
s) into °C/s I need to divide by 6,27*10**9
(from MeV to W) to divide by concrete density
(2,33g/cm3) and concrete conductivity (0,949
J/(g °C)) and to multiply by 1,87*10**15 p/s.
This way I obtain 1,35 °C/s. If I consider the
target will work 5000hours per year I get 2E7°C.
Is it possible to have such a thermal incre
from ambient temperature due to radiation?
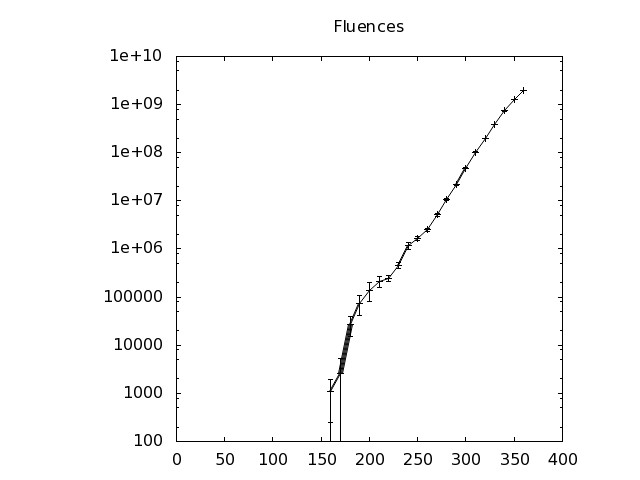
As for the USRBDX graph how do I read the y axis
of the plot, the x axis being [GeV], if I choose
as USRBDX Type: phi1,LogE,LinOmega that is:
fluence scoring, one way scoring, logarithmic in
energy, linear in angle? For my specific case
how should I normalize it? Is it correct to say
the spectrum is a typical fission spectrum? I
plotted a 1D graph of neutrons flux density
through the thickness (n/(cm2 s) vs cm): are
error bars acceptable? Can I catch the thermal
and the fast neutron behavior separately within the same graph.
And can I superpose similar 1-D graphs from
different shielding material (i.e. different input files)?
- In order to see fluences in all the
shielding I have further applied biasing;
order not to complicate geometry I have biased
with the usrbin.f subroutine I provide in
attachment; however as you can see from graphics
I did not better so much my analysis (just to
clear, I applied two different resolutions fo
the scoring: 5cm for biasing and 10cm for not biasing).
Is the biasing correct?
I am sorry if my questions are many or can
result trivial: I tried to put all in one mail.
I thank you in advance for a kind reply by your side,
Yours sincerely,
Beatrice Pomaro
Received on Wed Nov 17 2010 - 12:01:20 CET