Date: Thu, 25 Jun 2015 10:01:59 +0200
Dear all,
I ma Marine, "a newer”
I am starting to use FLUKA and to learn it I am doing simple examples.
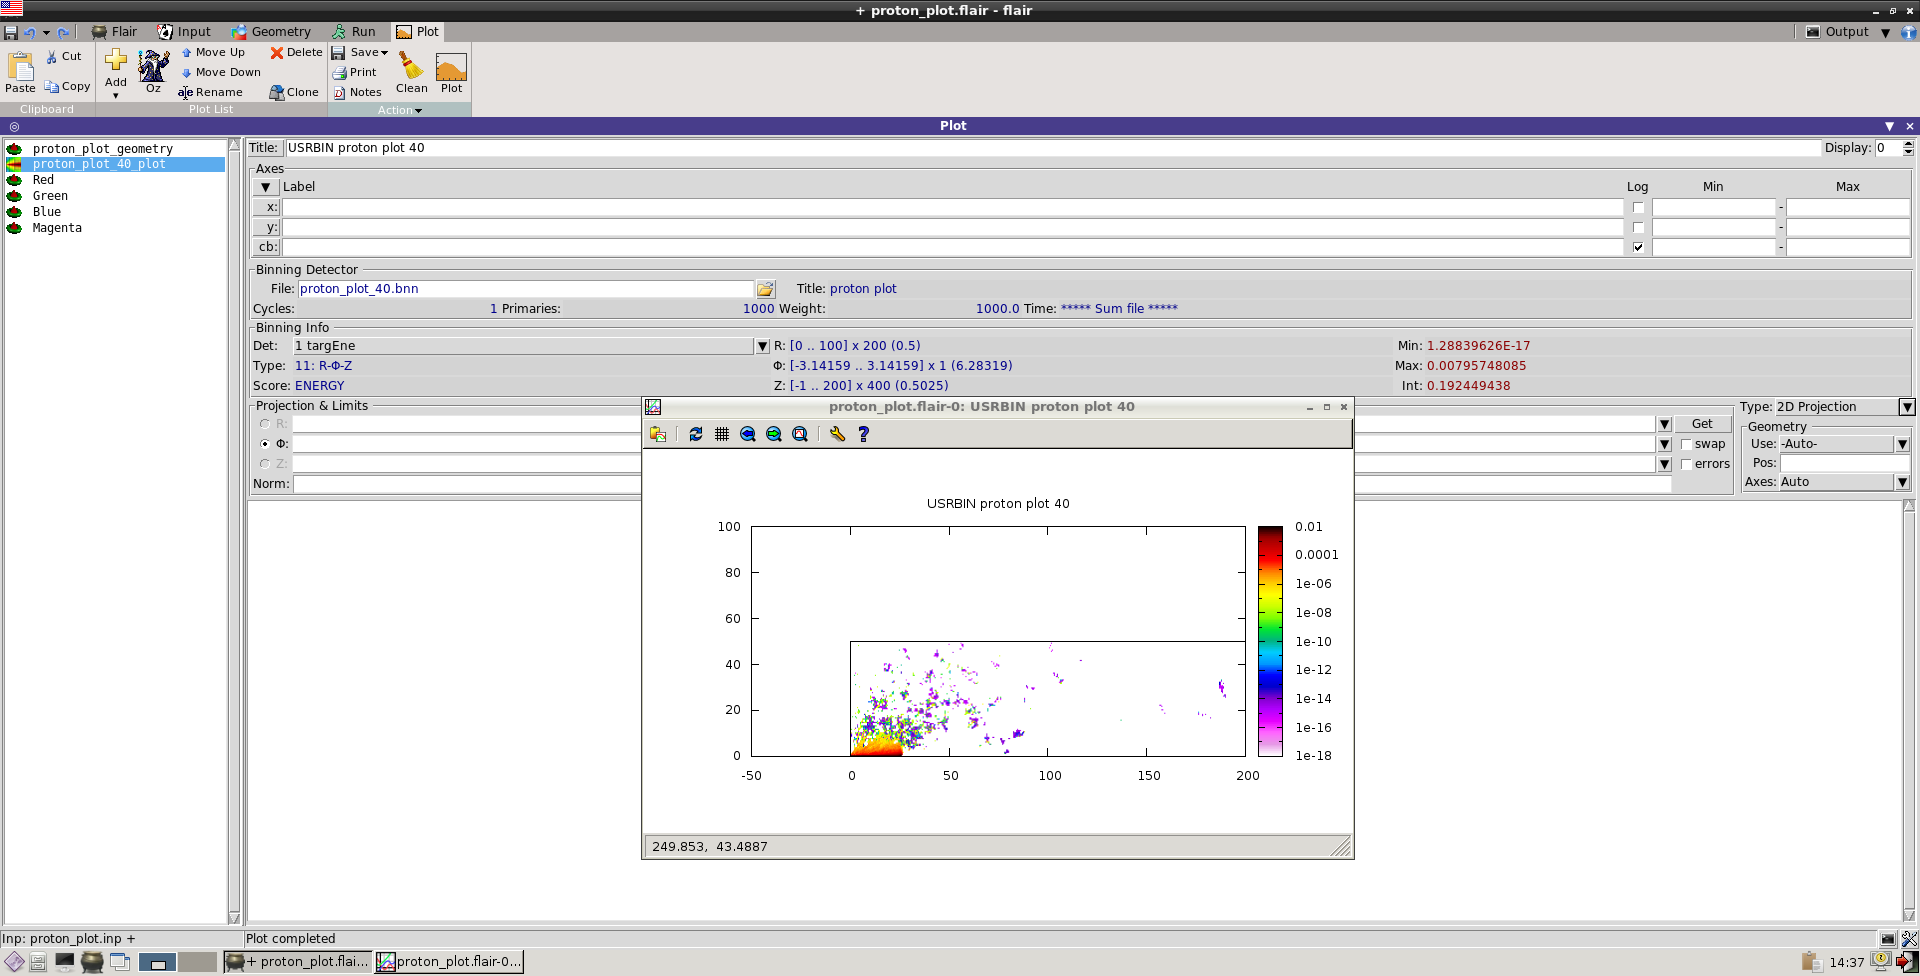
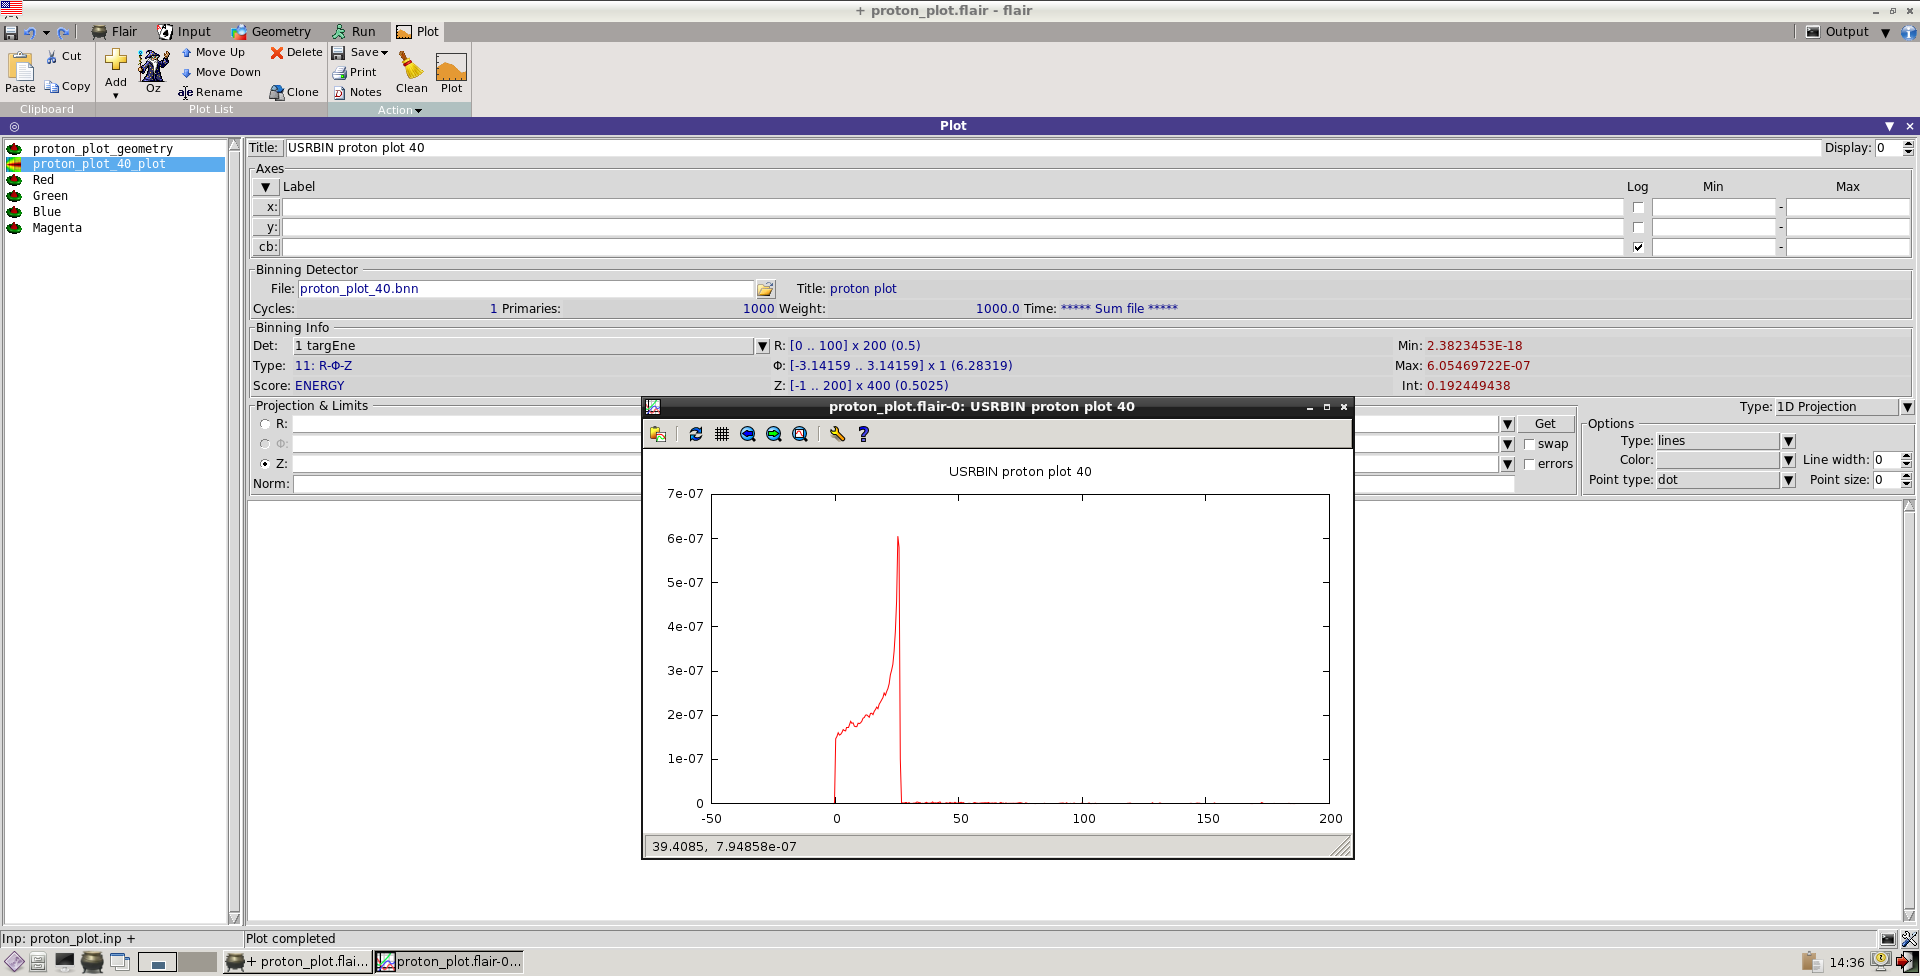
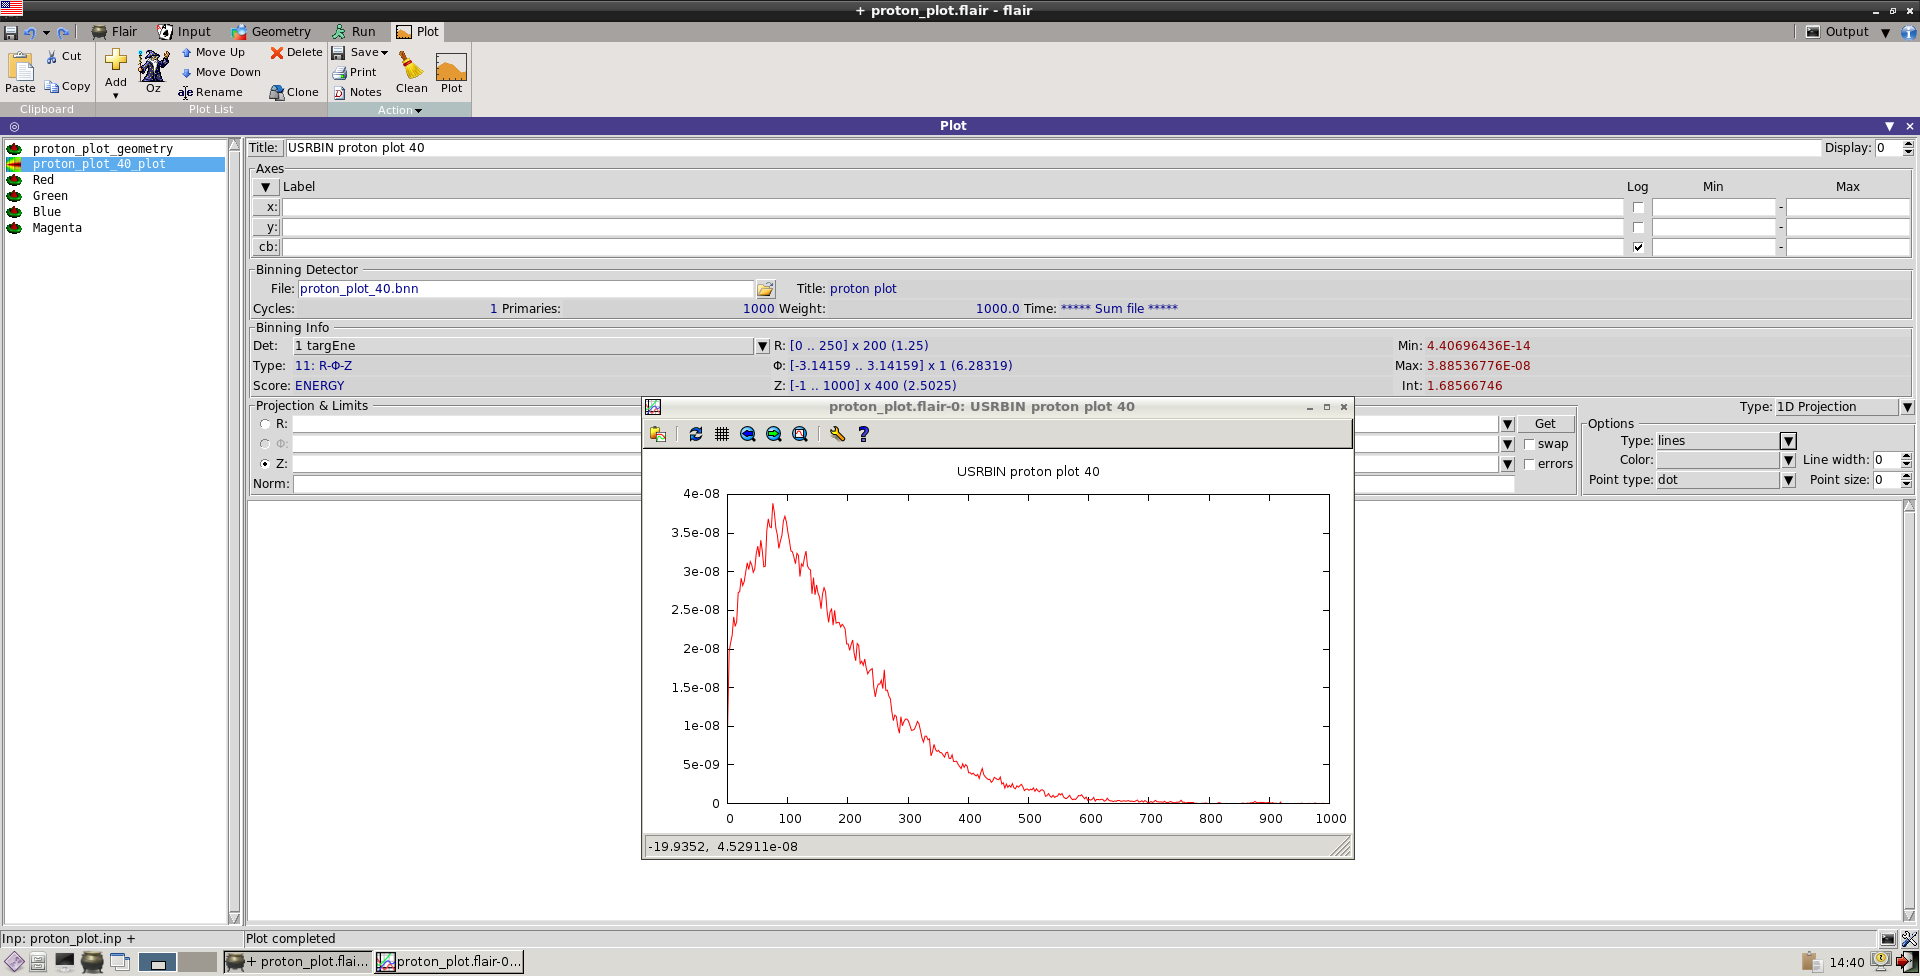
For example I am comparing FLUKA results for proton Bragg peak in water at
different energies with the data of NIST (PSTAR). I have good agreement for
proton energies until to 300 Mev (see attached file example 200 Mev) and
within this range I see clearly the Bragg peak. For energies above this
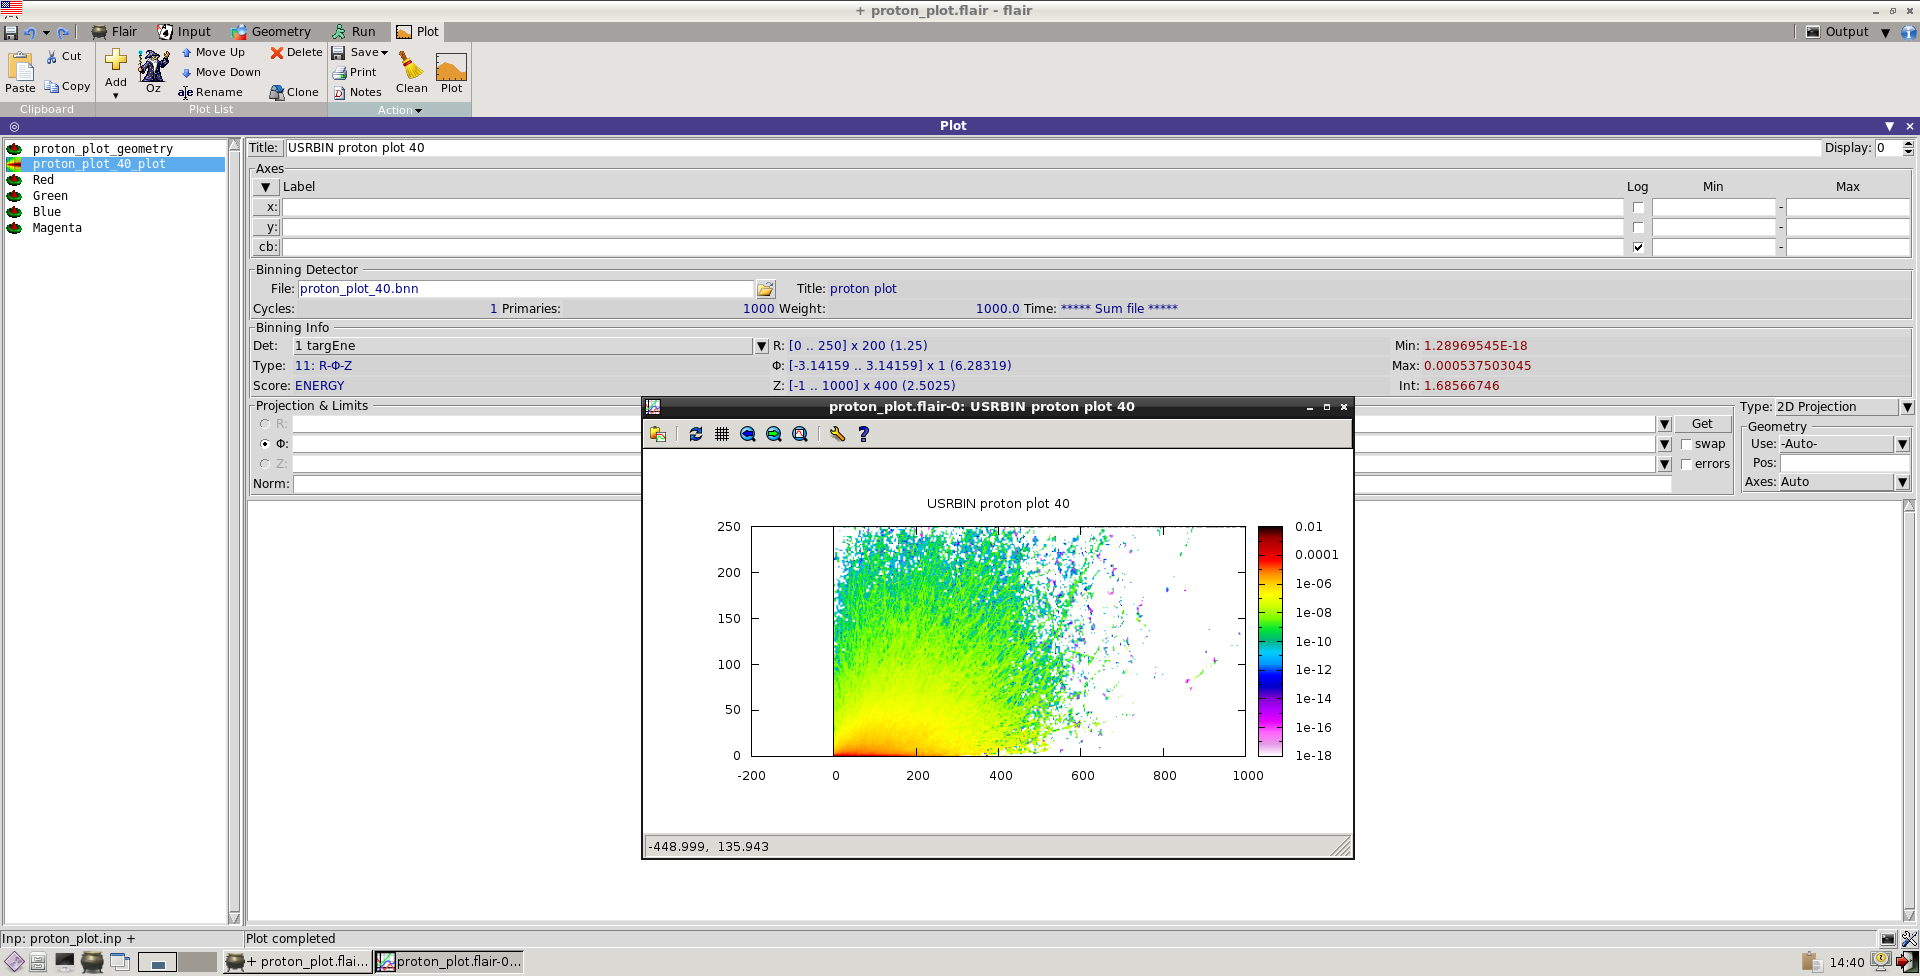
value the energy deposition change and the Bragg peace start to disappears.
For example for 2 GeV protons energy (see attached graph) the graph seems
more similar to electron deposition.
Is there any physics in the code that i am not accounting for ?
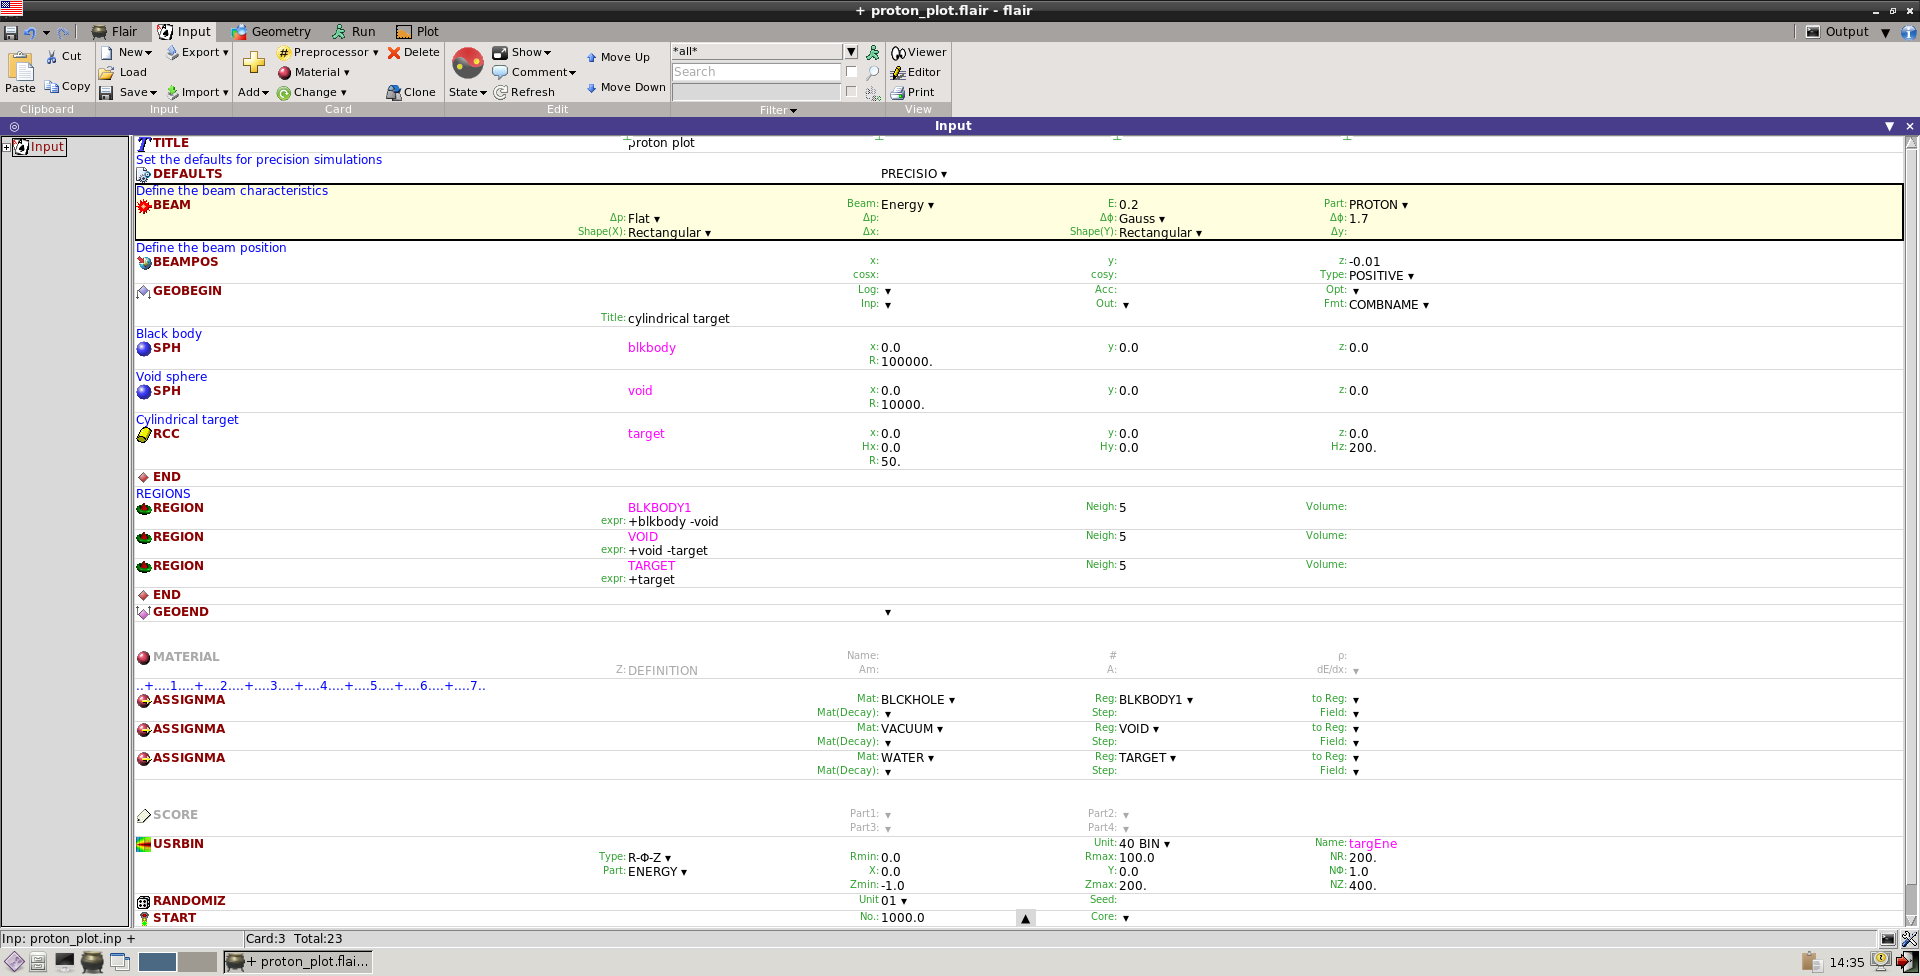
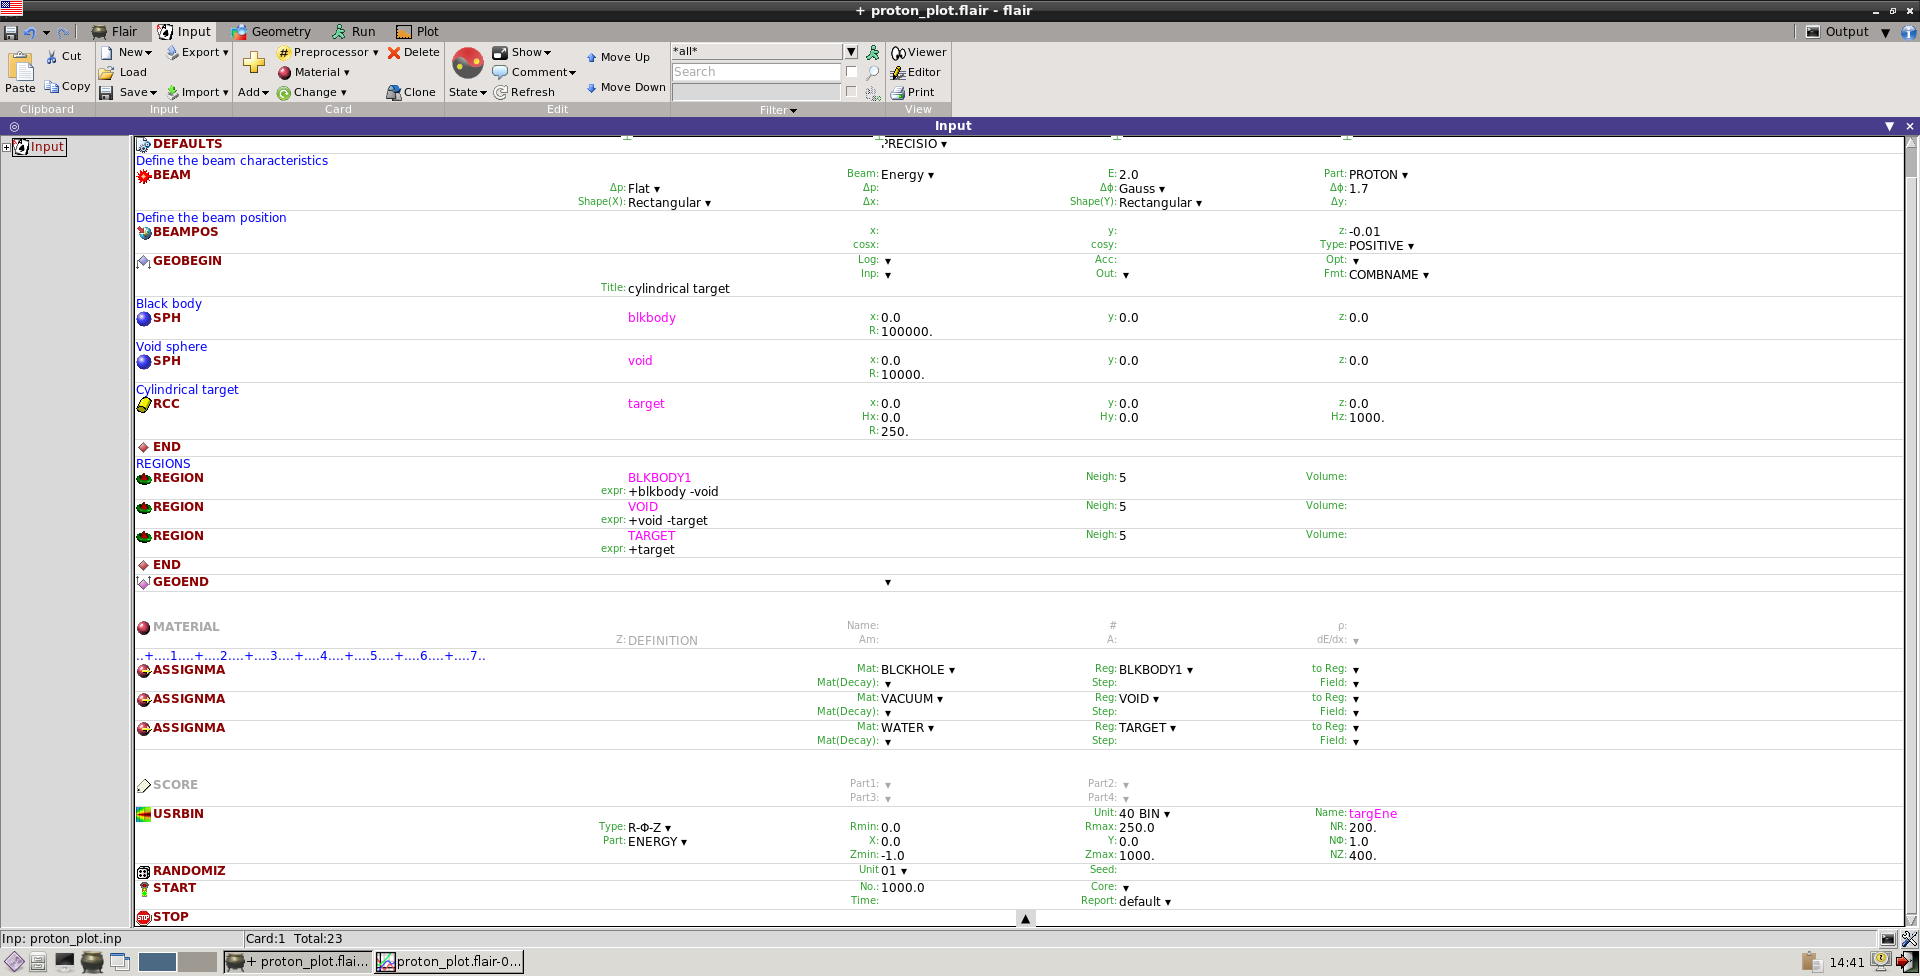
In addition I would like to ask how I can select the particle energy in
which I am interested.
To let you know now i am using the USRBIN card but I cannot find the way to
discriminate the particle energy.
I have similar problems also with electrons but let go step by step.
regards
Marine
------------------------
Marine Huault
Scientist
*CENTRO DE LASERES PULSADOS*
Building M5. Science Park USAL
Calle del Adaja, 8.
37185 Villamayor, Salamanca. SPAIN
__________________________________________________________________________
You can manage unsubscription from this mailing list at https://www.fluka.org/fluka.php?id=acc_info
(image/png attachment: Plot_2D_proton_200_MeV.png)
(image/png attachment: Plot_1D_proton_200_MeV.png)
(image/png attachment: input_proton_200_MeV.png)
(image/png attachment: Plot_2D_proton_2_GeV.png)
(image/png attachment: Plot_1D_proton_2_GeV.png)
(image/png attachment: input_proton_2_GeV.png)