Date: Tue, 5 Jul 2022 15:19:44 +0500
Thank you so much for your valuable answers,
I got your point of normalization using DETECT card, thanks for that
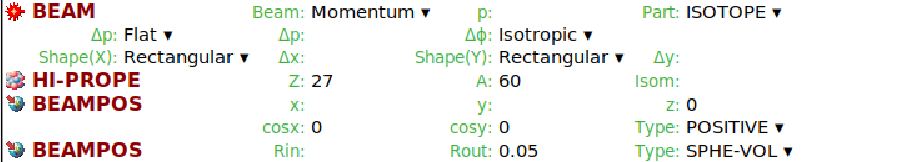
i. In our case, i define my source using these cards [image: 6.PNG]
But please guide me how to *define the activity of that source*? Is there
any default activity of that radioactive nuclides i.e 1 Ci or 5 Ci
ii. You said in the above mail that the efficiency of the detector is
calculated from FLUKA! Then *how to calculate* *detector efficiency* in
FLUKA? Is there a special card for that ?
If you have any input files about that, then please share it with me.
Thanks again
Noman Kaleem
On Tue, Jul 5, 2022 at 1:29 PM Paola Sala <paola.sala_at_mi.infn.it> wrote:
> Sorry I forgot: one should also be careful about the energy threshold in
> the experimental data,
> Paola
>
> On 7/5/22 10:09, Paola Sala wrote:
> > Dear Norman
> >
> > Some of the answers depend on the details of your setup and your
> > input. I will try to give some general hints.
> >
> > i. Depends on the activity of the source and of the time interval
> > during which the experimental data were taken, and the estimator you
> > used in Fluka. Almost all estimators give results normalized to one
> > primary particle, except for DETECT that is not normalized, and
> > EVENTBIN, that outputs results at each primary. If your radioactive
> > source has an activity of M Becquerels, and the experiment lasted L
> > seconds, the data normalization factor will be the total number of
> > source disintegrations: F=M*L. The Fluka normalization factor, as
> > said, depends on the estimator you used. Can be 1 or N where N is the
> > number of primaries.
> > Of course all this is valid only if the geometry is correct. I mean,
> > the distance from source to detector, container of the source, window
> > of the detector, angle of emission of the source, shielding around the
> > detector if any...All must be the same.
> >
> > ii and iii : see above.
> >
> > iv: yes
> >
> > Hope this helps
> > Paola
> > On 7/4/22 22:41, noman kaleem wrote:
> >> Dear Fluka experts,
> >> I'd used fluka for the simulation of a CsI detector and want to
> >> compare the obtained graph with the experimental data.
> >> Also I want to calculate the efficiency of the detector.
> >> i. I got the graphs from my simulation, they are quite similar to the
> >> experimental data but the obtained number of pulses related to the
> >> number of counts depends on what factor?
> >> ii. For detector Efficiency, we need no of counts emitted by the
> >> source and no of counts detected by the detector. How do we get both
> >> of them?
> >> iii. How to mention the activity of the source?
> >> iv. Is it possible to calculate the efficiency of the scintillator
> >> detector using FLUKA code?
> >>
> >> Required your valuable comments,
> >> Regards,
> >>
> >> Noman Kaleem
> >> nomankaleem786_at_gmail.com
> >
> >
> __________________________________________________________________________
> >
> > You can manage unsubscription from this mailing list at
> > https://www.fluka.org/fluka.php?id=acc_info
> >
>
>
__________________________________________________________________________
You can manage unsubscription from this mailing list at https://www.fluka.org/fluka.php?id=acc_info
(image/png attachment: 6.PNG)