Date: Tue, 13 Sep 2016 12:56:52 -0300
Dear Fluka experts
I have a problem
As exercise, I wanted to reproduce the first plot in this datasheet.
http://www.crystals.saint-gobain.com/uploadedFiles/SG-Crystals/Documents/PreLude%20420%20data%20sheet.pdf
I expected some differences between the data and the simulations, considering the low details about the experimental setup provided in the paper, but it is just to learn how to use the DETECT card
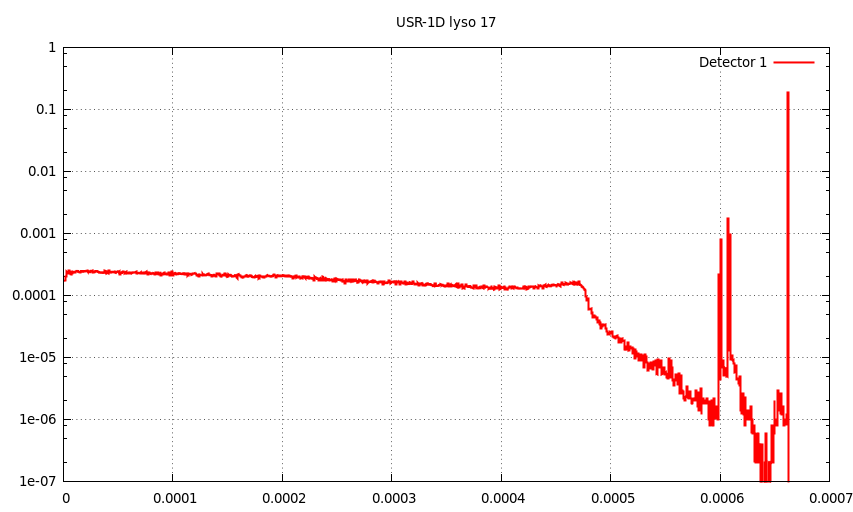
I obtained this plot (calorime attached), and I can’t understand why there is a bump between the Compton edge and the photopeak. I try to use different cards to treated properly the electromagnetic process, but without any success
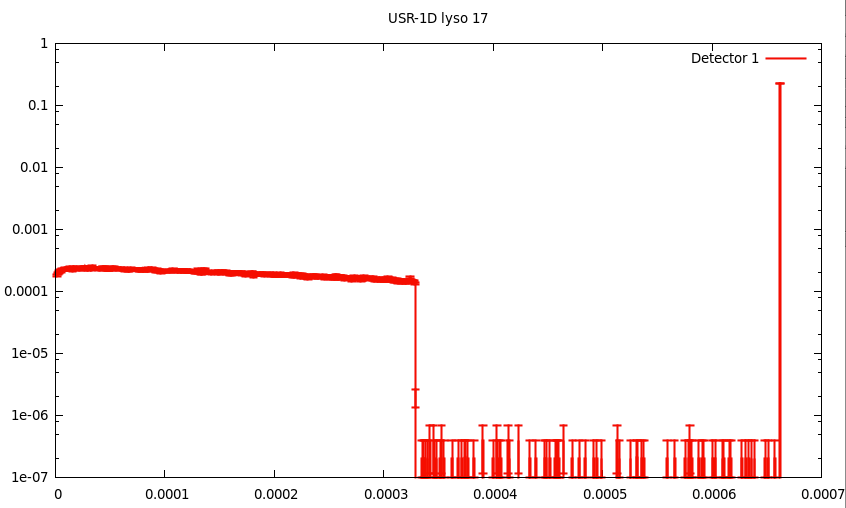
I tried to change the settings in the DEFAULTS card, and the only way to make the bump disappear is to use NEW-DEFA, but I can’t understand why (new-defa attached)
any help would be appreciate
best regards
andrea
__________________________________________________________________________
You can manage unsubscription from this mailing list at https://www.fluka.org/fluka.php?id=acc_info
(image/png attachment: calorime.png)
(image/png attachment: new-defa.png)
- application/octet-stream attachment: lyso.inp